Why Do We Need Habitat Conservation Plans?

Imagine you own a restaurant that was not performing well. To increase your revenue, you decide to build a second restaurant. After weeks of searching, you finally find the perfect spot. However, you soon find out that your new plot of land is a habitat for an endangered bat. You realize that if you build on this land, you could be breaking federal laws. So, what can you do? Habitat Conservation Plans are useful tools to help you mitigate the effects to an endangered species.

Endangered Species Act

Let’s take a trip back to the 1970s. The Endangered Species Act (ESA) was passed in 1973 to protect endangered and threatened animals and plants. The Act protects species and their habitats, along with the illegal removal and trade of wildlife. Here is where the idea of a “take” comes in. Take is defined by the ESA as “to harass, harm, pursue, hunt, shoot, wound, kill, trap, capture, or collect, or to attempt to engage in any such conduct.” An example of take would include habitat modification that results in injury, death or impairing a species.

An “incidental take” is a permit that is required if a company’s business activities could potentially encounter any listed plant or animal wildlife species. For example, if you had to cut down the endangered bats tree for your construction project, that would be considered an incidental take. Other examples of activities would include building over a habitat, removing a critical food source, and tearing down breeding grounds. These permits can apply to species that are listed as endangered and those that are non-listed as well.

Habitat Conservation Plans

The US Fish & Wildlife Service developed Habitat Conservation Plans (HCP) in 1982 to enforce the Endangered Species Act. HCPs are required to obtain an incidental take permit. HCPs determine the potential effects of the proposed actions on endangered species and create mitigation plans for the species in question. HCPs can be complex documents. An HCP consists of six major sections, which include:

  • Introduction and Background
  •  Project Description and Activities Covered by Permit
  •  Environmental Setting and Biological Resources
  •  Potential Biological Impacts and Take Assessments
  •  Conservation Programs
  •  Plan Implementation

Plans in Action

In 2006, Copper Mountain College in California decided to expand to meet the demands of the growing population of San Bernardino. The college was planning to expand its campus into an area where the threatened desert tortoise lives. This expansion would have resulted in a “take” as described in the Endangered Species Act. The college applied for a habitat conservation plan to mitigate the effects on the tortoise and to avoid take. For mitigation, the college designated an 85-acre plot to re-home the tortoise.

The plot now serves as a permanent tortoise preserve. In addition, the college monitors the preserve to ensure there are no threats from predators or human activity. The college also minimizes human activities by providing a Tortoise Awareness Program for residents in the area. As a result of their work, Copper Mountain College was recognized as an environmental steward for the Mojave Desert ecosystem. The Endangered Species Act was passed for organizations to act in the same manner as Copper Mountain College.

Habitat conservation plans are required for proposed projects that could infringe on a listed species’ habitat and possibly threaten that species. These plans take time and effort to complete, but the intention is to protect wildlife. If you plan to conduct a project that affects wildlife, remember to understand the regulations required for habitat conservation plans.

Sources

Copper Mountain College. (2018). Tortoise Awareness. Retrieved from https://www.cmccd.edu/wp-content/uploads/2018/01/CMC-Tortoise-Awareness-Training-2018a.pdf

U.S. Fish and Wildlife Service (n.d.). Habitat Conservation Plans. Retrieved from https://www.fws.gov/service/habitat-conservation-plans

Researchers Develop New Wetland Mapping Tool

(Mainali et al., 2023)

The use of remote sensing and geographic information systems (GIS) has become a crucial tool for land-use planning and conservation efforts. Wetlands prove to be one of the more difficult landscapes to map due to the limited availability of aerial imagery and their unique features. Wetlands do not share the same vegetative cover, hydroperiod, and topography across the board. These wetland features can interfere with the resolution of a remote sensor. This forces spatial analysts to develop workarounds for wetland mapping techniques.

New Mapping Tool

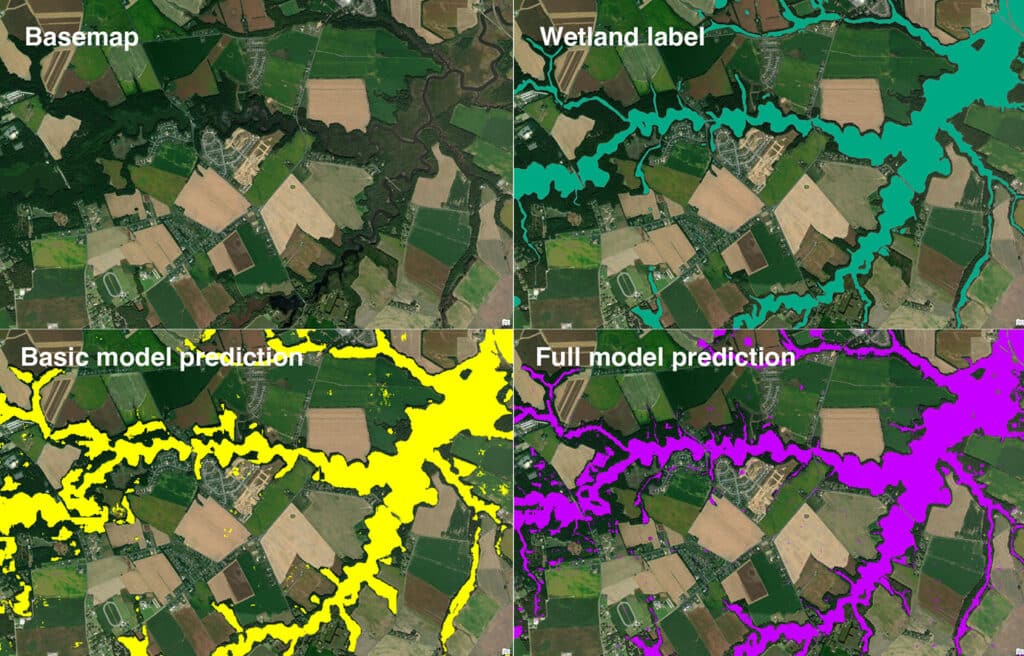
Researchers at the Chesapeake Conservancy have developed a new mapping tool that uses an artificial intelligence and machine learning algorithm to map wetlands. They tested the preliminary mapping tool at three different sites in Delaware, Minnesota, and New York.  After comparing the sites, they determined that the tool effectively mapped the wetlands in the surrounding area with ~94% accuracy at 1m2 resolution.

Deep Learning Technology

Deep learning technology has become widely popular, especially with the advancement of smart devices. Tools and features that utilize deep learning algorithms include facial recognition, virtual assistants, and autonomous vehicles. This type of technology is also known for its enhancement of imagery, which is where the technology comes into play with remote sensing applications.

The research group at Chesapeake Conservancy trained a deep learning model known as a convolutional neural network (CNN). CNNs are commonly used to segment multispectral imagery. The neural network was programmed to obtain imagery from freely available sources like the Sentinel-2 satellite and the National Agricultural Imagery Program (NAIP).

As discussed earlier, wetland vegetation can hinder a remote sensor’s ability to accurately map wetlands. Forested wetlands are one of the hardest wetland ecosystems to map as the tree canopy obscures any visible water from airborne sensors. To combat this, the researchers at Chesapeake Conservancy incorporated the use of light detection and ranging (LiDAR) data in the mapping model to fill in any data gaps from aerial images. LiDAR is a remote sensing method that uses laser beams to create a three dimensional display of the Earth’s surface and features. Once LiDAR data was incorporated into the model, the tool improved it’s mapping accuracy by 2%.

The research team used the NWI as reference data for their mapping tool, but quickly found discrepancies with what had been mapped on the NWI versus the current conditions in the field. With these discrepancies in mind, the research team presumes that their mapping tool could be more accurate than 94%.

Intended Use and Application

The hope for this tool is that it will develop new approaches to enhance the U.S. Fish and Wildlife’s National Wetland Inventory (NWI), and promote accurate wetland location predictions. The Chesapeake Conservancy is expanding the mapping model to other states to train the model on different geographies. It will be interesting to see how this model improves overtime and whether its usage will be released to the public for wetland identification.

Sources

Chesapeake Conservancy. (2023). Artificial intelligence deep learning model for mapping wetlands yields 94% accuracy. Retrieved from https://phys.org/news/2023-01-artificial-intelligence-deep-wetlands-yields.html.

Gallant, A.L. (2015). The challenges of remote monitoring of wetlands. Remote Sensing, 7(8), 10938-10950. Retrieved from https://doi.org/10.3390/rs70810938.

Mainali, K., Evans, M., Saavedra, D., Mills, E., Madsen, B., & Minnemeyer, S. (2023). Convolutional neural network for high-resolution wetland mapping with open data: Variable selection and the challenges of a generalizable model.
Science of The Total Environment, 861. Retrieved from https://doi.org/10.1016/j.scitotenv.2022.160622.

U.S. Fish and Wildlife Service. (n.d.). Wetlands data limitations, exclusions and precautions. Retrieved from https://www.fws.gov/node/264582

Plant Community Mapping

One of the biggest challenges to new delineators, and even some experienced wetland delineators, is getting the plant community mapping done right. This is a very important task as it serves as the basis for where and why the wetland sampling points are located where they are.  As you may recall, the US Army Corps of Engineers Wetland Manuals require that each plant community should be represented by a sampling point.

The Regional Supplements are not much help on this. They describe in very generic terms what some of the common plant communities in the region and even sub-region are. For example, this is an excerpt from the Eastern Mountains and Piedmont Regional Supplement.

Northern Mountains and Piedmont (MLRAs 147 and 148 of LRR S):

This sub region includes the northern Appalachian ridges and valleys (MLRA 147) and the northern Piedmont (MLRA 148). The ridge-and-valley portion is underlain by Paleozoic sandstones, conglomerates, limestones, and shales, whereas the Piedmont portion is underlain by generally older metamorphic and igneous rocks. The central portion of the Piedmont also contains sandstones, conglomerates, and shales that were laid down in the ancestral Atlantic Ocean during the Triassic period. Average annual rainfall over most of the sub region ranges from 31 to 52 in. (785 to
1,320 mm), and average annual temperature ranges from 44 to 57 °F (7 to 14 °C) (USDA Natural Resources Conservation Service 2006).

Only about 55 percent of the ridge-and-valley portion of the sub region and 25 percent of the Piedmont portion are forested today. Agricultural and urban development makes up the remainder of the sub region. Common tree species in forested areas include white oak, black oak, northern red oak, bear oak (Q. ilicifolia), chestnut oak, American elm, hickories, tulip tree, Virginia pine, pitch pine (P. rigida), eastern redcedar, and other species (Society of American Foresters 1980; USDA Natural Resources Conservation Service 2006).

As you can see, there is a general description of the trees found in the region.  However, there is not much else. In this example understory species are not mentioned and there is no discussion of the other plant communities in this area. The Corps goes on to later extol the need to identify the plant communities.

“The manual uses a plant-community approach to evaluate vegetation. Hydrophytic vegetation decisions are based on the assemblage of plant species growing on a site, rather than the presence or absence of particular indicator species. Hydrophytic vegetation is present when the plant community is dominated by species that require or can tolerate prolonged inundation or soil saturation during the growing season.”

So, getting this right is particularly important. To help you with this, I have a few tips and tricks to get you started.

First, you need to identify a plant community text for your region. For example in North Carolina, the Classification Of The Natural Communities Of North Carolina Third Approximation by Michael P. Schafale and Alan S. Weakley (1990) is a great reference document for understanding how these plant communities are distinguished.

This is an excerpt of the vegetation description for a specific plant community. Location, geology, soils and other features are described relative to this community type.

Carolina Hemlock Bluff

Vegetation: The canopy is well developed, though not always closed, owing to extreme rockiness and steepness. Tsuga caroliniana is the dominant trees; species such as Quercus montana (prinus), Pinus rigida, Pinus pungens, Quercus rubra, or Tsuga canadensis often occur. Undergrowth is generally a dense layer of heaths, especially Kalmia latifolia, Rhododendron catawbiense, Gaylussacia spp., and Vaccinium spp. The herb layer is very sparse below the dense shrub growth. Species may include Gaultheria procumbens, Mitchella repens, Chimaphila maculata, Galax urceolata (aphylla), Xerophyllumasphodeloides, and Trilliumundulatum. Bryophytes (Dicranumspp., Leucobryumalbidum, and L. glaucum) and lichens (Cladonia spp. and Cladina spp.) are sometimes prominent.

From this description alone you would be able to develop a plant list and assign wetland indicators.

In just about every state there exists a plant inventory and classification text.  Most of these are published by a state land grant university.  These are usually the major agricultural institutions.   However, in the North Carolina example one professor is from NC State and the other is from the University of NC.  NC State has a major agricultural program.  UNC is more of a research institution.  This collaboration has produced a terrific document and a great example of universities working together.  Just don’t bring up basketball.

Guide to Using a Laser Level

The use of a survey grade level is critical for obtaining accurate measurements of various biological features, biological benchmarks, etc.  This information is used for many purposes including stream restoration, coastal restoration, wetland restoration, and other design purposes.

There are two types of levels used for construction and design. The older of the two is known as the Dumpy level. This level is like a spotting scope with crosshairs. It is highly accurate (despite its name) and has an added advantage of being able to measure distance. However, it does require much more work to operate and is limited to a range of about 30 feet.  It also requires two people to operate.

Laser levels are the other commonly used measuring tool and are a significant improvement over the Dumby levels. The major benefit is that the distance away from the level is pretty much as far as you can see.  This reduces the number of station moves and speeds the process along.  You also only need to have one person to operate the level.

There is a third option which is to use a surveyor total station. This, however, is a complicated process and usually beyond the level of detail needed for most biological assessments.  A corollary to this is the use of GPS. GPS is great for x and y coordinates, but it is often meters off on the elevation (z).

Laser Levels

You do not need to spend a lot of money to purchase a quality laser level. You can often find these for sale in big box home improvements stores and hardware stores.  They are around a couple of hundred dollars. You can also rent one from a survey supply shop for about $20-$30 per day. Survey grade levels are usually in the $500 to $1000 range.  This is worth the investment if this type of work is a regular thing for you.  Also, do not cheap out on the box. The level will get bounced around so you will need a quality instrument case.  This is sometimes a problem with the home center levels.

The laser receiver is usually included with the laser level.  This is a little box that attaches to the survey rod with thumb screws.  It takes batteries and makes a tone when the laser beam from the level hits it.

The level should be placed upon a quality tripod. This is not the same type as you use for a camera. Survey grade tripods are usually made of wood or aluminum and have steel spikes to set it into the ground.  The legs are adjustable so that you can adjust your level. The level should be about chest high when mounted so the tripod needs to be 4-5 feet high when set up.

Next on your shopping list is a survey rod. You want to get the smallest rod that will serve the purposes of the site work you are doing. A 12-foot rod is much better than a 25-foot rod if you only need to go up a few feet. The bigger the rod the more sway you have, and the measurements will be less accurate. However, if you have a steep slope on your site, a bigger rod may be necessary.

You will also need a measuring tape or carpenter’s rule.  It is better to get one that is calibrated to 1/10’s of a foot rather than inches.  The survey rod is always in 1/10’s of a foot, however, make sure you are not using a metric rod.

Set Up

The first thing that you want to do is take a walk around the area that you need to survey. You want to find the best place to set up the level so that you do not need to move it more than necessary. Keep an eye on slope, trees and other obstructions.  The level needs a clear line of sight. You can clear some of the vegetation away, but it is usually easier to find a spot that would require the least amount of work to get your shots. The tripod should be set up above the highest point you are going to survey. You need to include the height of the level receiver on the rod when you are making this estimate. This translates to about 5 feet above your highest point. The level needs to be able to “see” the receiver.  If the level is set is too low it will shoot below the receiver mounted on the rod.  You can move the receiver down, but that would require that you recalculate for those shots.

Keep the level in the box until you are ready to place it on the tripod.  Do not attach it to the tripod and then walk around with it.  It should be boxed when moving it around the site.

Set the legs up on as level a surface as you can. Adjust the legs so that the level mounting plate is fairly level. You can use a hand level to do this or the bubble level on the laser level itself.

The laser level attaches to the tripod by way of a large screw below the mounting plate. Do not tighten this too much until you have leveled the level. There are three or four leveling screws on the level. There is also a glass bubble level on the mounting plate. Adjust the leveling screws so that the level is dead on the level in all directions. This will require that you spin the level around and make adjustments. If you have attempted to level the tripod before you mounted the level, this will go fairly quickly. 

Instrument Height

There is usually a marking on the level where you should measure downwards to the ground. We are also going to determine the height of the instrument using the back site, but you should always measure the distance from the instrument to the ground.

Backsight

You should place a project benchmark somewhere near the level set up. This serves as your project control and can be surveyed for real later if you need to derive actual elevation points from your level runs. This control should be set using a pin, rod, pipe or other relatively permanent makers. Wooden stakes do not work as they can be easily removed or damaged.

The backsight elevation is any number that makes sense. The convention is to set it at 100.  You may come back later in drag control onto the site to determine the actual elevation, but that is not necessary for this type of work.

The laser level indicator should be attached to the rod, usually at the tip. Note the location of the indicator. For example, it is on the rod at 4.5 feet. Most telescopic rods have a height indicator on the back of the rod.  As you raise the rod the height indicator numbers will change.  Be careful to raise the rod in the proper order.  This varies with some rod types so be sure to check with the manufacturer on the use of the rod.

A Direct Elevation Rod or a “ Lenker Rod ” is the most common type and has numbers in reverse order on a graduated strip that revolves around the rod on rollers. Figures run down the rod and can be brought to the desired reading—for example, the elevation of a point or benchmark. Rod readings are preset for the backsight, and then, due to the reverse order of numbers, foresight readings give elevations directly without calculating backsights and foresights.

Turn the laser on and position the rod on the benchmark and raise the rod until you hear a steady tone. You will usually hear a slow chip when you are just below the laser beam and a fast chirp when you go past it.  Note the rod reading. That is your backsight reading. Add the elevation from the benchmark rod reading and you have your height of instrument (HI).

For example, your benchmark is elevation one hundred. Your rod reading on that benchmark is 4.06.  Therefore, your Height of Instrument (HI) is 104.06’.  Your benchmark elevation should be lower than the instrument ground location.  If not, you need to adjust the detector and do some more math. It can be done, but it takes more time.

Now you are ready to go to work on the foresight.

Position the rod directly on the ground at each feature shot. The rod should be straight up and down. There are plumb levels you can attach to the rod to help you. Some laser detectors will also beep at you if you are too far out of plumb.

Raise the rod until you hear that steady tone. Note the rod reading. Make sure that you raised the rod in the right order and that the numbers are being read correctly.  Usually, this is a matter of checking reality.  If your rod reading suddenly jumps by 5 feet from the last point you may have raised the rod sections in the wrong order.

Record each feature and provide some notes. A level book works great for this. This is an example of a level book set up.

Set Up-Example 1

At each feature subtract the foresight (FS) from the Height of Instrument (HI) to derive the elevation.

In this example, we have a 1.28’ difference from mid tide (MT) to Mean High Water (MHW). We can, therefore, assume that our total tidal exchange would be 2.56’ from Mean Low Water (MLW) to MHW.

We would need to check many other points. Usually, for a biological benchmark survey, we would to stationing along a cross-section.  Each feature would be relative to the feature type and its location on the cross-section.  In our example above, the distance from the MT to MHW is 25’.  This is measured by setting a fixed starting point at 0+00 and measuring along that line.

If you need to move the level you will need to calculate a new HI.  Make sure to reference the setup with the data.  Start a new table for a new set up.

Finally, if you need to determine the real elevations of your features survey the benchmark. This will require a surveyor to locate nearby elevation control and drag that onto the site using traverse lines. You can also use high-end GPS for this.  In our example above the real elevation for the benchmark is 456’ NAVD 88.  Our new HI is 460.06.  We need to make sure we cite the vertical data source. In this case, it is North American Vertical Datum of 1988 (NAVD 88). Therefore, our MT is 453.43’ NAVD 88 and the MHW is 454.71’ NAVD 88. You can do this for all the data associated with the benchmark.

One final note

If you are doing level runs for design purposes, you may or may not need a licensed land surveyor to sign off on them.  However, if you are doing any floodplain calculation work you will most likely need the help of a licensed surveyor. Some jurisdictions allow licensed professional engineers to do this as well. This is a matter of state and federal law so be careful and ask questions.

Rock Quarry Shut Down for Filling Wetland

Source: Front Page Africa (2023)

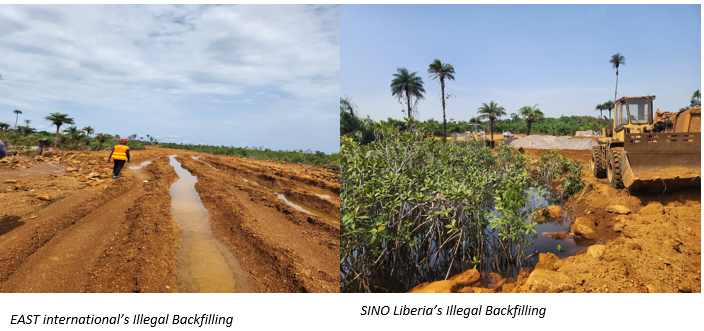
The Environmental Protection Agency of Liberia has shut down the Fengshou International rock quarry for backfilling the Marshall wetlands in Sheliflin Town. The firm that owns the quarry, Eastern International, has been cited with several violations under the Liberian Environmental Protection and Management Law (EMPL) and the company’s environmental permit.

Environmental Law and Permit Violations

The quarry was built for Eastern International to conduct its reconstruction project of the Roberts International Airport Highway. Dredging and filling the surrounding wetlands was not included in the scope of the environmental permit issued for the operation of the rock quarry. The firm applied for an additional permit to construct an access road through the Marshall wetlands from the quarry to the highway. In October 2022, the EPA conducted an environmental assessment for the prospective permit and determined the project would not be feasible without causing degradation to the wetlands. The permit was then denied, and the company was urged to abstain from building the road. Against the assessment of the EPA, Eastern International filled in the wetland to construct the access road.

Eastern International has been cited for non-compliance under their environmental permit and violation of Section IV: Part 75 under the EMPL. Unless the firm restores the wetland to its original condition, they could be subject to a $5,000 fine or imprisonment for at least two years. Director of the Liberian EPA, Wilson Tarpeh, stated the company neglected to conduct an Environmental Social Impact Assessment. This is an important compliance procedure that is integral to Liberia’s contribution to the Ramsar Convention.

Ramsar Wetlands

The wetlands in question were designated as a Ramsar wetland in 2006; thereby heightening the severity of the environmental consequences. In 1971, the Ramsar Convention agreement was signed by eighteen nations to recognize the ecological importance of wetlands and promote the wise use of wetlands worldwide. The Ramsar organization has made impressive strides in wetland conservation through its Wetlands of International Importance initiative (Ramsar sites). In signing the agreement, each signatory nation is required to designate at least one wetland as a Ramsar site. These wetlands are determined to be sites of social and ecological significance to the respective nation. As a fellow signatory of the Ramsar Convention, Liberia has designated five sites, including the Marshall wetlands

Current Status

On January 4, 2023, Wilson Tarpeh issued an order to shut down the production of the rock quarry. The order will remain in place until the wetlands are fully restored and approved by the EPA. It is currently unknown how this will impact the Marshall wetlands’ status as a Ramsar site or the nature of Ramsar’s involvement in this issue.

Sources

Front Page Africa. (2023). Liberia: EPA Shuts Down East Int’l, Sino Liberia Rock Quarry for Massively Backfilling Wetland in Marshall. Retrieved from https://frontpageafricaonline.com/news/liberia-epa-shuts-down-east-intl-sino-liberia-rock-quarry-for-massively-backfilling-wetland-in-marshall/

Ramsar. (n.d.). Wetlands of International Importance. Ramsar. Retrieved from https://www.ramsar.org/sites-countries/wetlands-of-international-importance

Ordinary High Water Mark Delineation Manual

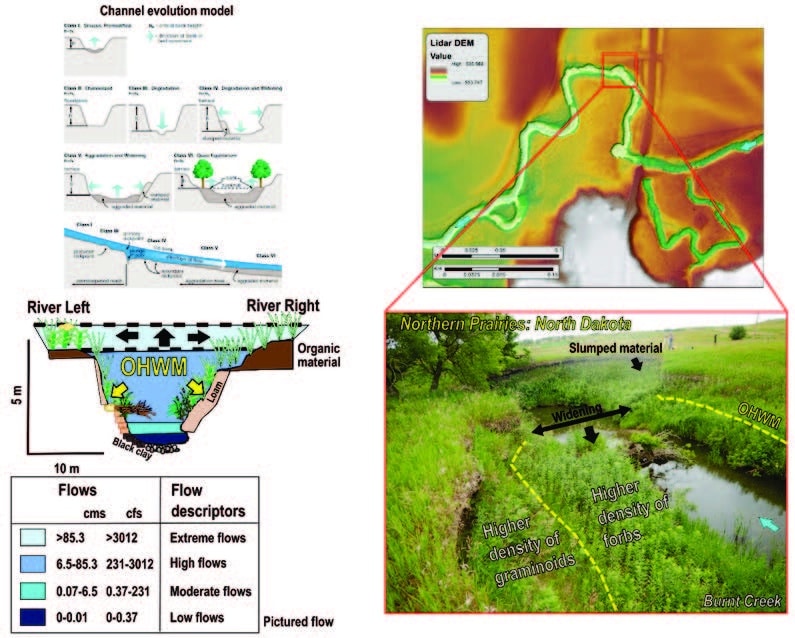
The U.S. EPA and the U.S. Army Corps of Engineers have issued an interim manual for delineation the National Ordinary High Watermark for rivers and streams. The ordinary high water mark (OHWM) defines the lateral extent of non-tidal aquatic features in the absence of adjacent wetlands in the United States. The Interim Draft of the National OHWM Manual provides draft technical guidance for identifying aquatic resources that may be subject to regulatory jurisdiction under Section 404 of the Clean Water Act (CWA) and/or Sections 9 and 10 of the Rivers and Harbors Act of 1899 (RHA), by providing a standard process, uniform datasheets, and unified field procedures to identify and delineate the OHWM of rivers and streams.

This is the first manual to present a methodology for nationwide identification and delineation of the OHWM. The manual provides a process for identifying the OHWM using stream characteristics observed in the field; it also provides information on how to use other lines of evidence to support field delineations. A data sheet and field procedure are included to guide users through the step-by-step process of identifying the OHWM. It also describes regional differences and challenges in identifying the OHWM at sites disturbed by human-induced or natural changes and illustrates how to use remote data to structure field inquiries and interpret field evidence using the principles of fluvial science. The manual demonstrates that, in many landscape settings, the OHWM may be located near the bankfull elevation. 

The public and practitioners are encouraged to test and provide comments on their experience using the Interim Draft National OHWM Manual. Comments on the Interim Draft National OHWM Manual should be submitted by email to usace.ohwm@usace.army.mil. Written comments may also be provided by mail to Mr. Matt Wilson, U.S. Army Corps of Engineers, Attn: CECW-CO-R, 441 G Street NW, Washington, DC 20314-1000. The one-year comment period ends on December 1, 2023.

Links for the Manual and Data Forms:

ERDC Knowledge Core: National Ordinary High Water Mark Field Delineation Manual for Rivers and Streams : Interim Version (dren.mil)

INTERIM DRAFT RAPID ORDINARY HIGH WATER MARK (OHWM) FIELD IDENTIFICATION DATA SHEET (defense.gov)

Ordinary High Water Mark (OHWM) Research, Development, and Training > Engineer Research and Development Center > Fact Sheet Article View (army.mil)

Sources

U.S. Army Corps of Engineers & U.S. Environmental Protection Agency. (2022). Notice of Availability of the Interim Draft of the National Ordinary High Water Mark Field Delineation Manual for Rivers and Streams. https://usace.contentdm.oclc.org/utils/getfile/collection/p16021coll15/id/756

Press Release: EPA and Army Finalize Definition of WOTUS

Background

On June 9, 2021, EPA and the Department of the Army announced their intent to revise the definition of “waters of the United States” to better protect our nation’s vital water resources that support public health, environmental protection, agricultural activity, and economic growth. On Nov. 18, 2021, the agencies announced the signing of a proposed rule revising the definition of “waters of the United States.”

The Clean Water Act prohibits the discharge of pollutants from a point source into “navigable waters” unless otherwise authorized under the Act. “Navigable waters” are defined in the Act as “the waters of the United States, including the territorial seas.” Thus, “waters of the United States” is a threshold term establishing the geographic scope of federal jurisdiction under the Clean Water Act. The term “waters of the United States” is not defined by the Act but has been defined by the agencies in regulations since the 1970s and jointly implemented in the agencies’ respective programmatic activities.

Press Release

The U.S. Environmental Protection Agency (EPA) and the U.S. Department of the Army (the agencies) announced a final rule establishing a durable definition of “waters of the United States” (WOTUS) to reduce uncertainty from changing regulatory definitions, protect people’s health, and support economic opportunity. The final rule restores essential water protections that were in place prior to 2015 under the Clean Water Act for traditional navigable waters, the territorial seas, interstate waters, as well as upstream water resources that significantly affect those waters. As a result, this action will strengthen fundamental protections for waters that are sources of drinking water while supporting agriculture, local economies, and downstream communities.

“When Congress passed the Clean Water Act 50 years ago, it recognized that protecting our waters is essential to ensuring healthy communities and a thriving economy,” said EPA Administrator Michael S. Regan. “Following extensive stakeholder engagement, and building on what we’ve learned from previous rules, EPA is working to deliver a durable definition of WOTUS that safeguards our nation’s waters, strengthens economic opportunity, and protects people’s health while providing greater certainty for farmers, ranchers, and landowners.”

“This final rule recognizes the essential role of the nation’s water resources in communities across the nation,” said Assistant Secretary of the Army for Civil Works Michael L. Connor. “The rule’s clear and supportable definition of waters of the United States will allow for more efficient and effective implementation and provide the clarity long desired by farmers, industry, environmental organizations, and other stakeholders.”

This rule establishes a durable definition of “waters of the United States” that is grounded in the authority provided by Congress in the Clean Water Act, the best available science, and extensive implementation experience stewarding the nation’s waters. The rule returns to a reasonable and familiar framework founded on the pre-2015 definition with updates to reflect existing Supreme Court decisions, the latest science, and the agencies’ technical expertise. It establishes limits that appropriately draw the boundary of waters subject to federal protection.

The final rule restores fundamental protections so that the nation will be closer to achieving Congress’ goal in the Clean Water Act that American waters be fishable and swimmable, and above all, protective of public health. It will also ensure that the nation’s waters support recreation, wildlife, and agricultural activity, which is fundamental to the American economy. The final rule will cover those waters that Congress fundamentally sought to protect in the Clean Water Act—traditional navigable waters, the territorial seas, interstate waters, as well as upstream water resources that significantly affect those waters.

More information, including a pre-publication version of the Federal Register notice and fact sheets, is available at EPA’s “Waters of the United States” website.

Accompanying the issuance of the final rule, the agencies are also releasing several resources to support clear and effective implementation in communities across America. Today, a summary of 10 regional roundtables was released that synthesizes key actions the agencies will take to enhance and improve implementation of “waters of the United States.” These actions were recommendations provided during the 10 regional roundtables where the agencies heard directly from communities on what is working well from an implementation perspective and where there are opportunities for improvement. The roundtables focused on the geographic similarities and differences across regions and provided site specific feedback about the way the scope of “waters of the United States” has been implemented by the agencies.

Today, the agencies are also taking action to improve federal coordination in the ongoing implementation of “waters of the United States.” First, EPA and Army are issuing a joint coordination memo to ensure the accuracy and consistency of jurisdictional determinations under this final rule. Second, the agencies are issuing a memo with U.S. Department of Agriculture to provide clarity on the agencies’ programs under the Clean Water Act and Food Security Act.

Sources:

Environmental Protection Agency. (2022, December 30). EPA and Army finalize rule establishing definition of WOTUS and restoring fundamental water protections [Press release]. https://www.epa.gov/newsreleases/epa-and-army-finalize-rule-establishing-definition-wotus-and-restoring-fundamental

Establishing Biological Benchmarks

A biological benchmark is a concept I first ran into while working in the Chesapeake Bay region. They are used in shoreline restoration projects that use native materials, often called living shorelines or vegetative erosion control.

The concept of biological benchmarks is based upon empirical data and direct observation of natural plant communities. The issue relates to specific hydroperiods that the native plants can tolerate. This results in an establishment of a given plant community based upon a frequency and duration of inundation by water. Many plant species have highly specific hydroperiod tolerances that can be measured in the field and extrapolated elsewhere.

The best example of plants with highly specific hydroperiods are represented by the coastal Spartina genus. Two of the Spartina species include Spartina alterniflora (cordgrass) and Sparitna patens (salt hay). Both species occur in the intertidal zone and are found all along the east coast and the Chesapeake Bay. They are salt marsh grasses that tolerate salt water.

What makes the two species of Spartina unique is that they only grow in two very distinct regions of the intertidal zone. S. alteniflora is found between mid-tide (MT) and extends up to mean high water (MHW). S. patens picks up from there and occurs between mean high water (MHW) and mean high high water (MHHW), or spring tide. What is amazing about this is that both species do not vary more than 0.1 feet in elevation from these tidal zones. They are very precise about where they will live.

To establish our biological benchmarks, we need to make sure that our study area is not under any major stress. This mostly comes in the form of bank erosion and herbivory. If either of these is excessive the area may not yield accurate results. I also use a fetch rule of thumb. Fetch is the distance from the shoreline across open water. This is measured perpendicular to the shoreline. If the fetch is more than one (1) mile, I do not consider the site suitable for further study. The wave action is just too great. High boat traffic can also be a problem. What usually happens in this circumstance is that my mid tide elevation is missing.

Once we have satisfied the disturbance issue we can start measuring. We need to take several elevation shots using a level of the extreme limits of both the S. alterniflora and S. patens. This is usually done using a laser level. First, establish and back site a site benchmark. Get your instrument height and then you are ready to start measuring fore site elevations. Each fore site shot should be corrected and converted based upon the site benchmark.

You should see a consistent range of elevations that can be extrapolated to MT, MHW and MHHW. This can be cross checked against the published tide tables for your region. If you have a two (2) foot tide range, then the elevation change from MT to MHW should be one (1) foot in height. The presence of the cordgrass should confirm this.

You may ask why all the bother if we have the tide tables? The answer relates to tidal restrictions and local variations. The tide tables will tell you what the exact elevation is at a given tide gauge. However, in survey terms you would need to drag that control across the water to your site. If there are no restrictions and you are close to the gauge you may be able to do this. However, one bridge or culvert between you and the gauge can have a dramatic effect on the tidal exchange.

I had a project in upstate New York on the Hudson River that had a major problem with tidal restrictions. It was a freshwater tidal marsh and had about a 1.5-foot tidal exchange at the gauge near West Point, NY. The gauge was across the river but close by. The marsh restoration designers had based their plant species selection and placement based upon the use of the gauge. Unfortunately, they missed the fact that there was a railroad crossing bridge between the marsh and the river. The bridge impinged the tidal flow into and out of the marsh by close to a foot. The result was that the tidal exchange inside the marsh was about 0.75 feet rather than the calculated 1.5 feet. Now this may not sound like a significant difference, but it would result in the marsh planting being placed about a foot above the waterline. This would be bad as the plants were all emergent species and required frequent inundation.

Biological benchmarks saved the day. We were able to establish the proper elevation for the new marsh based upon the observed limits of a few selected freshwater tidal species. There is a species of Typha that is unique to the region that served as a great biological benchmark indicator species. The result was the design was lowered by about a foot and all the plants were happy. The trick to all of this is the need to understand what the plants require. Once you understand what the plants need, the rest falls into place.

Wetland Resilience in a Changing World

When it comes to wetlands as ecosystems, resilience is a concept that describes ecosystems’ capacity to persist in their present state when facing natural forces such as droughts, floods, and wildfires. In some cases, resilience refers to the rate at which the ecological system has the ability and capacity to return to its equilibrium. Wetlands have the natural capacity to manage change, regardless of whether water level changes, temperature changes, chemistry, or other factors might impact the overall wetland condition.

Wetlands are precious resources that provide essential ecosystem services to communities. Many scientists and ecologists agree that wetlands provide disproportionately more ecosystem services than other ecosystems. Wetlands filter out the sediments, nutrients, and other harmful pollutants to humans. They can capture, store, and slowly release stormwater runoff and snowmelt. This slows down the water flow, reduces the flood peaks, increases infiltration, and provides a steady source of base flow to lakes and streams. Additionally, wetlands are habitats for many fish species, which are essential economic assets and support plants and wildlife, making the wetlands an ideal place for recreation.

Despite their natural benefits, wetlands are still vulnerable to changes in landscapes and the weather patterns resulting from climate change. Even the slightest imbalance in the narrow hydrological ‘bandwidth,’ such as too much or too little water, can have immense consequences for wetlands. Sediments, nutrients, invasive species, and other inputs arising from landscape changes can impair wetlands’ ability to provide resiliency. Extreme weather events due to climate change, including increased sea level, unplanned land-use practices and alterations, and super-fast urbanization, directly impact the wetlands. These ecosystems are threatened worldwide, and all factors can potentially lead to a cascade of ecological consequences, such as acidification, harmful algae blooms, hypoxia, contamination of drinking water aquifers, and loss of biodiversity.

Opinion: Could Cattle Farming Protect Wetlands?

As previously mentioned, wetlands provide numerous benefits, including economic benefits, and support the resiliency of our agricultural landscapes. Wetlands have an astounding ability to sequester carbon and filter water, support pollinators and biodiversity, and provide wildlife habitat, including many endangered species. Humans can use these benefits in a rationally and environmentally friendly way. Approximately 25 % of the world’s wetlands are found in Canada.

Farmers are among those who experience the adverse effects of climate change daily. Concurrently, this group of individuals commonly receives a substantial amount of blame for the changing climate. Still, in Canada, farmers and ranchers possess some of the most promising solutions to climate mitigation. Raising cattle helps in the preservation of wetland ecosystems. In Canada, the landscape is suitable for raising beef cattle while supporting natural systems. With proper management and strategies, cattle farming can successfully co-exist and provide environmental co-benefits to ecosystems like wetlands.

More and more cattle farmers are becoming aware of new farming methods and are investing in their business to protect wetlands. Some of these measures include solar-powered water troughs and strategic cattle movement at certain times of the year. This has positive benefits for both ranchers and nature: habitat preservation is crucial for the health and the vitality of the land and animals, and it is fundamentally connected with the sustainability of their business.

The overlapping uses of growing food and conservation are assets that need to be valued and responsibly managed. To conserve nature, farmers must nature to use the lands responsibly and with an appreciation of their invaluable worth. Farmers from across the globe need to start applying these techniques and support the resiliency of the landscapes long into the future.

Sources:

Bhattachan, A. et al. (2018). Sea level rise impacts on rural coastal social-ecological systems and the implications for decision making. Environmental Science and Policy, 90, 122-134. https://doi.org/10.1016/j.envsci.2018.10.006

Chescheir, G.M., Skaggs, R.W., Gilliam, Wendell, & Broadhead, R. (1991). Hydrology of two forested wetlands that receive pumped agricultural drainage water in Eastern North Carolina. Wetlands, 11, 29-54. http://dx.doi.org/10.1007/BF03160839

Heffernan Lab. (n.d.). Wetland resilience and self-organization. Duke University. https://heffernanlab.weebly.com/wetland-resilience.html

Matson, P.A., Parton, W.J., Power, AG, & Swift, M.J. (1997). Agricultural intensification and ecosystem properties. Science, 277(5325), 504-509. https://doi.org/10.1126/science.277.5325.504

Ribaudo, M., Delgado, J., Hansen, L., Livingston, M., Mosheim, R., & Williamson, J. (2011). Nitrogen in agricultural systems: Implications for conservation policy. United States Department of Agriculture Economic Research Service. 10.2139/ssrn.2115532.

Tapley, K. (2022). Opinion: Wetlands and resilient landscapes. A match made in Canada. Canadian Cattlemen. https://www.canadiancattlemen.ca/news/opinion-wetlands-and-resilient-landscapes-a-match-made-in-canada/

Nature-Based Solutions Roadmap

The Biden-Harris Administration released their recommendations “roadmap” to the National Climate Task Force with the intention of accelerating the use of nature-based solutions (NBS) in the United States. The roadmap stems from the 2021 Bipartisan Infrastructure Law and Inflation Reduction Act and Executive Order 14072, which directed Federal agencies to identify opportunities to expand the implementation of natural and nature-based solutions. The administration announced its plan to expand nature-based solutions at the 2022 United Nations Climate Change Conference. They are planning to allocate about $25 million in infrastructure and climate funding to support integrating nature-based solutions.

What are Nature-Based Solutions?

The White House defines nature-based solutions as “actions to protect, sustainably manage, or restore natural or modified ecosystems to address societal challenges, simultaneously providing benefits for people and the environment”. Best management practices (BMPs) act as a vehicle for achieving the broad principles of nature-based solutions. There are several types of BMPs that are used to mimic natural processes like permeable pavement, greenways, rain gardens, and constructed wetlands.

Wetlands and Nature-Based Solutions

Wetlands and their functions can be applied to several different nature-based solutions. The roadmap cites a wetland’s ability to reduce greenhouse gas emissions through wetland conservation, improve inland flooding, capture and treat stormwater runoff through constructed wetlands, and restore community culture through recreational activities. A common nature-based solution used to protect coastal and freshwater wetlands from shoreline erosion and storm surge are living shorelines. Living shorelines are structures comprised of natural materials like rocks, plants, and sand that act as protection for shorelines. They are often used in place of hardened structures like sea walls or jetties.

The Goals of the Roadmap

The Administration finds nature-based solutions to be the key to improving climate change and environmental inequities. To combat climate change, the administration proposes that the increased use of nature-based solutions can reduce greenhouse gas emissions and increase rates of carbon sequestration. In their recommendation, they state conserving and restoring critical habitats like grasslands, forests, and wetlands will contribute to one-third of the climate mitigation required to reduce global warming below 2 degrees Celsius by 2030. Environmental inequity plays directly into improving the effects of climate change as at-risk communities experience climate change at a disproportionately higher rate. In their roadmap, the White House makes a point to utilize nature-based solutions as methods to mitigate environmental justice issues and prevent further inequities.

Strategy and Challenges Ahead

To accomplish their goal, the Biden-Harris Administration suggested five strategies and recommendations for Federal agencies to adopt in their practices. The five action areas in their roadmap are:

1. Update Policies to Accelerate Nature-Based Solutions
2. Unlock Funding for Nature-Based Solutions
3. Lead with Federal Facilities and Assets
4. Train the Nature-Based Solutions Workforce
5. Prioritize Research, Innovation, Knowledge, and Adaptive Learning

While the Administration is hopeful to implement nature-based solutions, they identified potential roadblocks that would hinder the widespread use of nature-based solutions. In their note, they identified their main challenges as:

  • Insufficient awareness of nature-based solutions
  • Regulatory and policy hurdles
  • Difficulty accounting for cost and benefits
  • Insufficient and uncoordinated funds
  • Limited federal, community, and workforce skills and knowledge
  • Gaps in evidence of effectiveness

It will be interesting to see how well these nature-based solutions are incorporated into Federal agencies and future policies over the next two years. To learn more about the Administration’s recommendations, please refer to the roadmap here: https://www.whitehouse.gov/wp-content/uploads/2022/11/Nature-Based-Solutions-Roadmap.pdf