Hydric Soil Indicators

The most common soil type we encounter in wetlands is the “F” group of hydric soils.  These are the loamy mineral soils.  The texture needs to be a fine sand or finer.  Usually, we are looking at silts and clays.

Of all the indicators in the “F” group, the two most common ones are the depleted matrix, “F3”, or the dark surface, “F6.”  It is not unusual to find both in the same soil pit.  Both indicators are dependent upon soil color as their hydric condition test.

There are many variations of color associated with the “F” indicators.  However, a basic rule of thumb is that they need to have a Munsell matrix chroma of 2 or less.  There are provisions for chromas greater than 2 found in some of the other indicators.  However, for the “F3” and “F6” we need to see colors that are at least as dark as a 2.

There is still some pushback from the old-time delineators on these new indicators.  For decades we used a single indicator for soil color.

  • Matrix chroma is 2 or less in mottled soils
  • Matrix chroma is 1 or less in unmottled soils

This must occur at a depth of 10 inches or the bottom of the “A” horizon whichever is shallower.

This definition served us well, but it is no longer in use.  However, when we look at the new “F” indicators we see that the old definition is buried in them (sorry for the pun).

One other oldie is the concept of mottling.  This term has been replaced with the concept of redoximorphic features.  We now refer to dark features as redox depletions and bright features as redox concentrations.  Mottling always meant a mix of soil colors.  However, it usually was expressed when the dark features were in the matrix (dominant color) and the bright features were individual masses.  The use of the redox concentrations and redox depletions is much more descriptive and a change for the better.

Thickness of the indicator feature is also a new concept.  Many of the “F” indicators not only require a specific soil color, but also a thickness associated with it.  For example, a matrix with a chroma of 2 must be at least 6 inches thick in order to count as a hydric soil feature.  To make this a bit more challenging some of these thickness requirements can be combined with other hydric soil indicators thickness   requirements to make up any missing thickness goals.  This only applies to certain indicators like the “F3” and “F6”.

The last caveat is that some of these features must occur within certain depth limits to count as a hydric soil feature.   You must see the feature start at a specified depth and then extend for a certain thickness.  On aspect of the “F3” requires that a depleted matrix must start in the upper 12 inches of the soil and extend for at least 6 inches.  Thickness and depth are combined.

The “F3” indicator is one of the most frequently found indicators.  It is referred to as a depleted matrix.   There is a tricky part to this indicator regarding the use of the US Army Corps Regional Supplements.  The definition of a depleted matrix is found in the glossary along with a nice graphic of what it means.  The problem is that the hydric soils section leads you to believe that the full description of the feature is found within they hydric soil indicator description.  It does not.  You need to check the glossary.

The description starts with the idea that you have a depleted matrix.  You need to know what a depleted matrix is.  This involves an analysis of the soil color and percent redox features.

A depleted matrix is:

Depleted matrix. The volume of a soil horizon or sub horizon from which iron has been removed or transformed by processes of reduction and translocation to create colors of low chroma and high value. A, E, and calcic horizons may have low chromas and high values and may therefore be mistaken for a depleted matrix. However, they are excluded from the concept of depleted matrix unless common or many, distinct or prominent redox concentrations as soft masses or pore linings are present. In some places the depleted matrix may change color upon exposure to air (reduced matrix); this phenomenon is included in the concept of depleted matrix. The following combinations of value and chroma identify a depleted matrix:

  • Matrix value of 5 or more and chroma of 1, with or without redox concentrations occurring as soft masses and/or pore linings, or
  • Matrix value of 6 or more and chroma of 2 or 1, with or without redox concentrations occurring as soft masses and/or pore linings, or
  • Matrix value of 4 or 5 and chroma of 2, with 2 percent or more distinct or prominent redox concentrations occurring as soft masses and/or pore linings, or
  • Matrix value of 4 and chroma of 1, with 2 percent or more distinct or prominent redox concentrations occurring as soft masses and/or pore linings (USDA Natural Resources Conservation Service 2010).

Common (2 to less than 20 percent) to many (20 percent or more) redox concentrations (USDA Natural Resources Conservation Service, 2002) are required in soils with matrix colors of 4/1, 4/2, and 5/2. Redox concentrations include iron and manganese masses and pore linings (Vepraskas, 1992).

Once you figure that out you just need to look for depth and thickness of feature.

A layer with a depleted matrix that has 60 percent or more chroma of 2 or less and that has a minimum thickness of either:

  • 2 in. (5 cm) if the 2 in. (5 cm) is entirely within the upper 6 in. (15 cm) of the soil, or
  • 6 in. (15 cm) starting within 10 in. (25 cm) of the soil surface.

The “F6” indicator does not require a depleted matrix.  It is described as a dark surface as follows:

A layer that is at least 4 in. (10 cm) thick, is entirely within the upper 12 in. (30 cm) of the mineral soil, and has a:

Matrix value of 3 or less and chroma of 1 or less and 2 percent or more distinct or prominent redox concentrations occurring as soft masses or pore linings, or

Matrix value of 3 or less and chroma of 2 or less and 5 percent or more distinct or prominent redox concentrations occurring as soft masses or pore linings.

I should add that distinct or prominent redox features are defined by the color contrast between these features.  Please check the Regional Supplement glossary for a full description.  We also printed it on our soil bandana.

These two soil indicators can also be combined to meet the thickness requirements of either feature.  This may vary by Regional Supplement so make sure to check with the Corps for any local interpretations.

Beaver Dam Creates Wetland During Drought

Beavers are an integral part of freshwater wetland ecosystems. The formation of their dams reduces the flow of freshwater streams and floods the surrounding area, turning it into a shallow wetland environment (Beavers, Wetlands, & Wildlife, n.d.). In creating these wetlands, beaver dams recharge groundwater supplies and provide nursery habitats to other aquatic species.

Despite their role as “ecosystem engineers”, beavers have been socially perceived as nuisances as their habitat continues to be fragmented by human development (NRDC, 2017). The USDA conducted a study to determine the response to beaver control, which found that 99% of responses utilized lethal force (NRDC, 2017). With this unique instance of human-wildlife conflict, numerous methods of non-lethal control methods have been introduced to landowners. These methods could include constructed barriers to protect the surrounding area from flooding, devices like Beaver Deceivers which prevent beavers from blocking road culverts, or simple monitoring techniques that observe water levels in beaver ponds (NRDC, 2017).

Drought in the UK

The United Kingdom’s Environment Agency has declared drought status throughout the southwest region of England. The Agency claims the current conditions are the driest the region has experienced in 90 years based on the hydrologic data collected over the last 5 months (Environment Agency, 2022).

Several areas in the southwest are observing the effects of the drought as the dry season continues. The lead of the Environment Agency’s drought team, Chris Paul, stated the “river levels across our Wessex area are exceptionally low – many showing the lowest flows on record. This places incredible strain on local wildlife, and this is why we are moving to drought status” (Environment Agency, 2022). As of August 30, 2022, the Environmental Agency has announced that 11 of their 14 regions in the UK have declared drought status (The Guardian, 2022). Several water companies throughout England have implemented hosepipe bans in an effort to conserve water for the remainder of the summer (The Guardian, 2022).

New Wetland in Devon County

The southwest county of Devon is among the many UK counties experiencing the effects of the drought. However, a system of beaver dams on the Clinton Devon Estate has flooded about 2.5 acres of land to create a freshwater wetland (Watson, 2022). The estate has been historically used as farm and cropland. There is a lot of uncertainty between the Devon farmers of how this wetland will impact their ability to farm (Watson, 2022). This creates an especially complex situation as beavers are soon to be federally protected in the United Kingdom. On October 1, 2022, the Eurasian beaver will be protected from trapping, killing, injuries, or disturbance without a license (Prior, 2022).

In response to this action, the National Farmers’ Union (NFU) announced their concern that beaver dams can have a negative impact on farmland as their habitat promotes upstream flooding (NFU, 2021). It is likely that the farmers and landowners of the Devon Estate will have to work carefully with the NFU and the government to create a comprehensive plan to protect the beavers on their property while maintaining the integrity of their land.

Sources:

Beavers, Wetlands,& Wildlife. (n.d.). Beavers & Wetlands. Beavers, Wetlands, & Wildlife. Retrieved from https://www.beaversww.org/beavers-wetlands/#:~:text=Because%20beavers%20build%20their%20stick,the%20land’s%20most%20beneficial%20ecosystem.

Environment Agency. (2022). All of England’s South West region now in drought. Environment Agency. Retrieved from https://www.gov.uk/government/news/all-of-england-s-south-west-region-now-in-drought

NFU. (2021). Beavers and flooding: The impact on British farms. NFU. Retrieved from https://www.nfuonline.com/updates-and-information/beavers-and-flooding-the-impact-on-british-farms/

NRDC. (2017). Beavers: Nature’s Wetland Ecosystem Engineers. NRDC. Retrieved from https://www.nrdc.org/sites/default/files/beavers-wetland-ecosystem-engineers-fs.pdf

Prior, M. (2022). Eurasian beaver to be given legal protection in England. BBC News. Retrieved from https://www.bbc.com/news/science-environment-62213459

The Guardian. (2022). All of south-west of England in drought, says Environment Agency. The Guardian. Retrieved from https://www.theguardian.com/environment/2022/aug/30/drought-all-south-west-england-environment-agency

Watson, E. (2022). Beaver dams in east Devon create area of wetland amid drought. BBC News. Retrieved from https://www.bbc.com/news/uk-england-devon-62662909?xtor=AL-72-%5Bpartner%5D-%5Bbbc.news.twitter%5D-%5Bheadline%5D-%5Bnews%5D-%5Bbizdev%5D-%5Bisapi%5D&at_custom3=%40BBCNews&at_medium=custom7&at_custom4=DAB7EB26-2510-11ED-AA51-55B64744363C&at_campaign=64&at_custom2=twitter&at_custom1=%5Bpost+type%5D

Securing a Jurisdictional Determination

A Jurisdictional Determination, also known as a “JD”, represents a US Army Corps of Engineers’ determination of the presence and/or extent of “waters of the US” on any given property. However, there are two types of JDs. One represents the official findings of the Corps, and the other is more or less an estimate. Both JDs have their purposes. It is important to recognize the difference between the two types because one could get you into a lot of trouble.

Approved JDs

An approved JD (AJD) is an official Corps determination that jurisdictional “waters of the United States,” “navigable waters of the United States,” or both, are either present or absent on a particular site. An approved JD precisely identifies the limits of those waters and determined to be jurisdictional under the Clean Water Act and/or the Rivers and Harbors Act.

An approved JD:

  1. Constitutes the Corps’ official, written representation that the JD’s findings are correct;
  2. Can be relied upon by a landowner, permit applicant, or other “affected party” (as defined at 33 C.F.R. 331.2) who receives an AJD for five years (subject to certain limited exceptions explained in RGL 05-02);
  3. Can be used and relied on by the recipient of the AJD (absent extraordinary circumstances, such as an approved JD based on incorrect data provided by a landowner or consultant) if a CWA citizen’s lawsuit is brought in the Federal Courts against the landowner or other “affected party,” challenging the legitimacy of that JD or it’s determinations;
  4. Can be immediately appealed through the Corps’ administrative appeal process set out at 33 CFR Part 33

If wetlands or other water bodies are present on a site, an AJD for that site will identify and delineate those water bodies and wetlands that are subject to Clean Water Act jurisdiction, and serve as an initial step in the permitting process.

Preliminary JDs

Preliminary JDs (PJD) are non-binding; “… written indications that there may be waters of the United States, including wetlands, on a parcel or indications of the approximate location(s) of waters of the United States or wetlands on a parcel. Preliminary JDs are advisory in nature and may not be appealed.”

The main purpose of a Preliminary JD is speed a project along. There are several scenarios where this type of JD would accomplish this:

  1. An applicant, or other “affected party”, may elect to use a preliminary JD to voluntarily waive or set aside questions regarding CWA jurisdiction over a particular site. Usually in the interest of allowing the landowner or other “affected party” to move ahead expeditiously to obtain a Corps permit authorization where the “party” determines that is in their best interest to do so.
  2. For purposes of computation of impacts, compensatory mitigation requirements, and other resource protection measures, a permit decision made on the basis of a preliminary JD will treat all waters and wetlands that would be affected in any way by the permitted activity on the site as if they are jurisdictional waters of the U.S.
  3. Preliminary JDs are also commonly used in enforcement situations if a site may be impracticable, unauthorized, or for reasons that prevent an approved JD to be completed in a timely manner. In such circumstances, a preliminary JD may serve as the basis for Corps compliance orders (e.g., cease and desist letters, initial corrective measures). The Corps should support an enforcement action with an approved JD, unless it is impracticable to do so under the circumstances.

Which Should You Use?

It is the Corps’ goal to process both preliminary JDs and approved JDs within 60 days. The applicant or other affected party’s choice of whether to use a preliminary JD or approved JD should not affect this goal.

As the “waters of the U.S” definition is currently in a state of limbo, all future permits and JDs issued will be reviewed under the pre-2015 regulatory regime. Previously approved permits or JDs under the 2020 Navigable Waters Protection Rule are subject to review.

To learn more about the current guidance for wetland permits and JDs, please refer to U.S. EPA’s page on the current implementation of “waters of the U.S.”: https://www.epa.gov/wotus/current-implementation-waters-united-states

Deepwater Horizon Wetland Restoration

On August 4, the Louisiana Trustee Implementation Group (LTIG) issued their latest plan to restore coastal wetlands, marshes, and habitats previously damaged by the Deepwater Horizon (DWH) oil spill. The plan focuses on four project goals to be accomplished:

  1. Two projects for engineering and design: 
    • New Orleans East Landbridge Restoration will provide engineering and design for a project intended to create and restore marsh habitat that separates Lake Pontchartrain from Lake Borgne and the Gulf of Mexico. 
    • Raccoon Island Barrier Island Restoration will provide engineering and design for a project intended to create and enhance beach, dune, and tidal habitats through sand fill placement and shoreline protection.
  2. Two projects are selected for construction: 
    • Bayou Dularge Ridge and Marsh Creation is intended to create and nourish marsh on the south side of Bayou Dularge and restore the ridge along the southern bank of Bayou Dularge. 
    • Bayou La Loutre Ridge Restoration and Marsh Creation is intended to create and nourish marsh along Lena Lagoon, and restore the ridge along the southern bank of Bayou La Loutre. 

This plan is estimated to total around $75 million in recovery costs to complete these four projects. (NOAA Fisheries, 2022).

Wetland Habitat Loss

The Deepwater Horizon spill caused innumerable injuries to marine and coastal wildlife and habitats in the Gulf of Mexico. It is estimated that over 687 miles of wetlands along the Gulf Coast were lost from exposure to oil, vegetation loss, and accelerated erosion (NOAA, 2016). This loss is not only an incredible detriment to the natural environment, but proved to impact the residents of the Gulf states as well. Coastal wetlands and barrier islands across the Gulf Coast provide several ecosystem services like storm protection and flood control measures.

The Louisiana coastline is known for experiencing the most rapid decline of shoreline and coastal wetlands in the Nation. Within the state, there are over 3 million acres of wetlands, accounting for 40% of wetlands in the United States (U.S. Geological Survey, n.d.). As a result of the oil contamination along the Gulf, the rate of wetland decline in Louisiana has almost doubled (The National Wildlife Federation, n.d.).

The rapid decline of coastal marshes after the DWH spill stems from the direct contamination of wetland vegetation. Claudia Copeland and M. Lynne Corn stated in their research article for the Congressional Research Service that continuous exposure to oil can cause wetland vegetation to suffocate and die. Thus, causing the soil to collapse and accelerate the rate of soil erosion and overall wetland loss (Corn & Copeland, 2010).

Deepwater Horizon Natural Resource Damage Assessment Trustee Council

The Trustee Council consists of numerous state and federal agencies that study the effects of the spill and work towards recovering the Gulf Coast (Deepwater Horizon Natural Resource Damage Assessment Trustee Council, n.d.). The state agencies of Alabama, Louisiana, Mississippi, Texas, and Florida work closely with U.S. EPA, the Dept. of Agriculture, NOAA, and the Dept. of Interior. Each state leads their respective implementation group to focus on specific areas damaged by the spill.

In 2020, the Gulf Coast Ecosystem Restore Council published a comprehensive 10-year status report on the restoration projects throughout the Gulf. In their report, they state that about $177 million has been approved thus far to initiate 46 restoration projects throughout the Gulf (Gulf Coast Ecosystem Restore Council, 2020). Projects throughout the Gulf states are in various stages of progress to focus on engineering and design, water quality, habitat restoration, and nature-based tourism (NOAA, 2020).

Restoration of Wetlands, Coastal, and Nearshore Habitats

The LTIGs Final Restoration Plan/Environmental Assessment #8: Restoration of Wetlands, Coastal, and Nearshore Habitats is one of several installments for the Trustee Councils programmatic restoration plan. As outlined by the Councils by-laws, this plan is in aims to:

  • Restore a variety of interspersed and ecologically connected coastal habitats in each of the five Gulf states to maintain ecosystem diversity, with particular focus on maximizing ecological functions for the range of resources injured by the spill, such as oysters, estuarine-dependent fish species, birds, marine mammals, and nearshore benthic communities.
  • Restore for injuries to habitats in the geographic areas where the injuries occurred, while considering approaches that provide resiliency and sustainability.
  • While acknowledging the existing distribution of habitats throughout the Gulf of Mexico, restore habitats in appropriate combinations for any given geographic area. Consider design factors, such as connectivity, size, and distance between projects, to address injuries to the associated living coastal and marine resources and restore the ecological functions provided by those habitats. (LTIG, 2022)

With the focus on restoring these four barrier island sites, these projects are instrumental to bolstering the sustainability of Louisiana’s coastline and mitigating the environmental injuries caused by the DWH oil spill.

Sources:

Corn, M.L. & Copeland, C. (2010). The Deepwater Horizon Oil Spill: Coastal wetland and wildlife impacts and response. Congressional Research Service. Retrieved from https://highschoolenergy.acs.org/content/dam/acsorg/policy/acsonthehill/briefings/oilspillmitigation/crs-r41311.pdf

Deepwater Horizon Natural Resource Damage Assessment Trustee Council. (n.d.). Trustees: Working together. NOAA. Retrieved from https://www.gulfspillrestoration.noaa.gov/co-trustees

Gulf Coast Ecosystem Restore Council. (2020). Restore council: 10-year commemoration report. Gulf Coast Ecosystem Restore Council. Retrieved from https://www.epa.gov/sites/default/files/2020-04/documents/restorereport2020_v6.pdf

Louisiana Trustee Implementation Group. (2022). Final restoration plan/environmental assessment #8: Restoration of wetlands, coastal, and nearshore habitats. Louisiana Trustee Implementation Group. Retrieved from https://www.gulfspillrestoration.noaa.gov/sites/default/files/2022-08-LA-Final-RP-EA8-w-appendices-508.pdf

NOAA Fisheries. (2022). NOAA Fisheries Bulletin: Louisiana Trustees Approve Plan to Restore Wetlands, Coastal, and Nearshore Habitats. Retrieved from https://content.govdelivery.com/accounts/USNOAAFISHERIES/bulletins/326a578

NOAA. (2016). Effects of the Deepwater Horizon Oil Spill on coastal salt marsh habitat. Office of Response and Restoration. Retrieved from https://response.restoration.noaa.gov/about/media/effects-deepwater-horizon-oil-spill-coastal-salt-marsh-habitat.html

The National Wildlife Federation. (n.d.). Deepwater Horizon’s impact on wildlife. The National Wildlife Federation. Retrieved from https://www.nwf.org/oilspill

U.S. Geological Survey. (n.d.). Louisiana coastal wetlands: A resource at risk. USGS. Retrieved from https://pubs.usgs.gov/fs/la-wetlands/

Wetland Soil Auger Buyer’s Guide

One of the most frequently asked questions by our wetland delineation students is, “what type of soil auger should I buy?”

A quick browse through any of the forestry supply companies’ catalogs and you are quickly overwhelmed. Who would have thought that there we so many different types of soil augers? Some of them are quite expensive. Many are modular and you end up buying part of an auger and have to order more parts. You do not want to drop a grand on an auger only to find out it is not what you needed or expected.

To help you get a handle on this, I have put together a pros and cons list of the most common soil augers used for wetland delineation. This list is based on my personal field experience with these augers. Each has its place so be prepared to buy a few. I do have a favorite all-around auger which I will also cover, but I own a bunch!

Tube Sampler

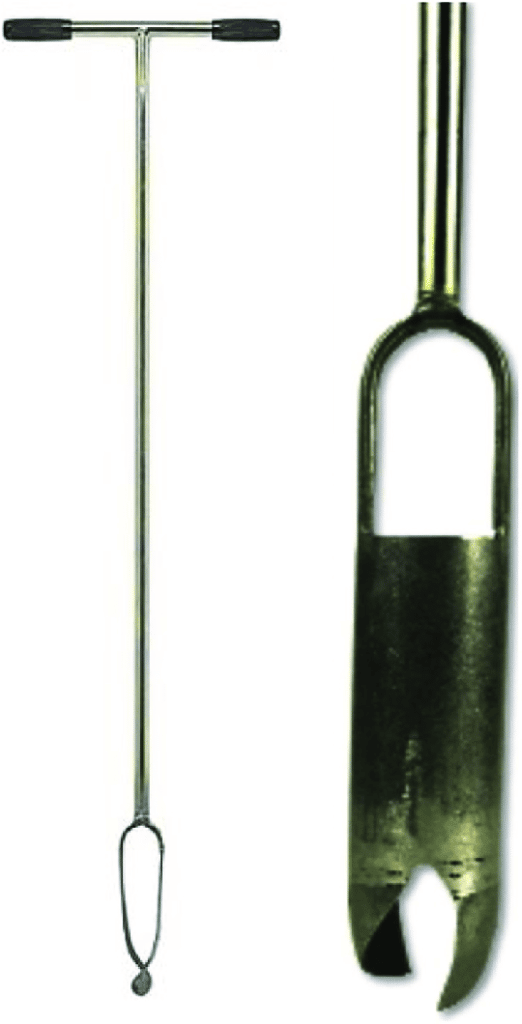
This is a favorite for the beginning wetland delineator. One of its biggest assets is that it is the cheapest, however, it has limitations. The basic construction is a simple tube that is cut open at the bottom. There is usually about a 16-inch half pipe slice that is used to examine the soil profile in-situ. The very end is a ring that everyone gets their fingers stuck in. A good one is about 24 inches in length with an opening extending about 16-18 inches. There is a short t-handle on the top. Sometimes this is detachable with a screw fitting. Others have the handle welded on. The former is a bit more expensive. One of the biggest advantages of this type of auger is the small footprint it makes. In glacial regions, it is sometimes the only auger that can get in between the rocks. It is also very handy for quick assessments. The biggest disadvantage is the relatively small amount of soil sample this auger extracts. Oftentimes, it just is not enough sample to make a wetland determination. Small rocks are also a problem as they will plug up the tube end. The issue of cleaning the sampler end out is also a challenge. It is sharp and just the right size to get your finger stuck. Use a stick to clean it out!

Screw Sampler

This auger looks like a giant corkscrew. The screw is about a foot long and is about 2-3 feet in total length. The screw is usually attached by extension bars that can be added to achieve a comfortable length. It has a slightly larger footprint than the tube sampler and is similarly useful in glaciated regions. The biggest challenge with using this auger is the ability to measure the thickness of a hydric soil feature. The screw blades are about .5 inches thick. This results in a stretching of the soil sample. It is hard to estimate how thick a feature may be using this auger. It also provides a very small soil sample.

Bucket Auger

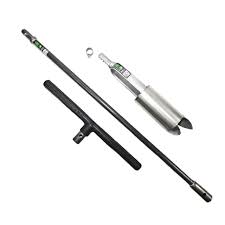
This is probably the most common type of auger used by soil scientists, however, it is not necessarily used by wetland delineators. The basic design looks like a coffee can with one end open and the other end having two blades welded onto it. An extension bar connects in between the bucket and a t-handle on the top. All of these items can be customized to fit the user’s needs.

If you are just starting out in wetland delineation, you will probably be handed one of these bucket augers. There always seems to be one hiding in the office closet. Someone bought it, used it once, and there it sits.

I do not have a lot of pros to offer with this type of auger. The biggest problem is that it grinds up the soil profile, making it very hard to distinguish the hydric features of the soil. It also requires that once you auger down and grab a sample, you then have to tip the bucket upside down and bang out the sample. This also obscures the features. Soil scientists like these augers because they are trying to obtain a discrete sample at a specific depth. This is usually why the extension bars are so long. I have seen some augers used in the field that were over 6 feet long.

Dutch Auger (My Favorite)

This auger was made for wetland delineations. It is a double blade at the end of an extension bar and t-handle. It cuts a very nice sample without disturbing the profile integrity. You can usually auger down several feet fairly easily and lay out the samples in more or less the same way they would be found in the pit. You also get a decent amount of samples to play with. There are a number of brands and styles for this type of auger. The biggest difference between the individual styles is represented by the size and pitch of the blades. The original use of the Dutch auger was for muddy soils. However, there have been many modifications to the design. There is such a thing as a combination auger that works well in loamy soils as well as mud.

Sharp-Shooter

This is also known as a tree planting spade. It is simply a shovel that is 4 inches wide and 16 inches long. It digs a small hole and cuts a nice sample. In a pinch, this shovel will work in almost any circumstance. The biggest advantage to this sampler is the cost. You can pick one if these up in your local home improvement center for about $25. Most of the other augers mentioned are well north of $200. The biggest downside to this device is the work associated with it. Digging a hole is a lot of work. You get a nice amount of samples and you can even cut a nice sidewall to see the profile. However, this typically takes a lot of work due to the size of the spade.

Quick Connect or Not

One last note on the issue of quick connects. To be frank, I have yet to see one of these work once they were put to use in the field. The fittings get gummed up with dirt and the quick connect jams. I would suggest going with an all-welded design. You are not going to take these apart anyway so why spend the extra money? If you need to travel by airplane, TSA is not going to let you carry these on, so there is no need to break them down. Just check them, or better yet, buy a shovel for $25 when you get to the job site.

Can Urban Wetlands Benefit Stressed-Out City Dwellers?

Whether one prefers long walks, hikes, or connecting with wildlife through meditation and exercise, spending time in nature is beneficial for mental and physical health and wellbeing. Over time, as population increases and towns and cities occupy larger areas, nature is more difficult to access. As people migrate to urban areas, they tend to forget the importance of spending time outside in nature. According to an article by Hannah Ritchie and Max Roser, it is predicted that by 2050, close to 7 billion people will live in urban areas (Ritchie & Roser, 2018).

Wetlands and Urbanization

Wetlands are water-rich natural areas that occur mainly along rivers, coastal plains, and deltas. These areas are often subject to urbanization. As a result of urban expansions, groundwater levels decrease, which puts pressure on wetland functions.

Urban wetlands serve as green spaces where city dwellers can recreate and connect with nature. These wetlands are designed so that the polluted water from its surroundings is filtered through the artificial wetland. Unlike natural wetlands, flow patterns can change and specific zones fall dry over time. Artificial wetlands are partially controlled by humans, making these wetlands less dynamic than natural wetlands. As a result, certain visual qualities and uses remain seemingly unchanged over time.

Artificial Wetlands as Affordable Wastewater Treatment

Urban wetlands have the capability to purify urban water efficiently and affordably. Unlike conventional waste-water treatment systems, artificial wetlands are a substantially cheaper solution that require minimal maintenance (EPA, 2015).

The EPA provides several resources for the design and implementation constructed wetlands for the purpose of recycling urban wastewater. They state in their article “Constructed Wetlands for Wastewater Treatment and Wildlife Habitat” that constructed wetlands treatment systems fall into two categories: Free Water Surface Systems and Subsurface Flow Systems. These categories are differentiated by their targeted use objectives; Subsurface Flow Systems are focused on improving water quality, while Free Water Surface Systems are utilized to improve wetland habitat functions (EPA, 2015). Subsurface Flow Systems are designed to filter water through a permeable material below the wetlands surface, as to not create any nuisances or odors (EPA, 2015). This system would be an ideal mechanism for urban wetlands as residents could enjoy the green space while the wastewater below them is purified.

Both natural and urban wetlands play a critical role in coastal stabilization and flood protection. Sediment settles down in deltas, thus creating a natural barrier that prevents water from penetrating deeper into the soil. The multiple roles wetlands play for humans, as well as urban environments, are the reason why more constructed wetlands have been utilized as green space in recent years.

Importance of Urban Wetlands for Overall Wellbeing 

The benefits of urban wetlands’ ecosystem services are immeasurable, but how are urban wetlands used as a means of social prescribing? Does spending time in nature, specifically wetlands, positively impact overall health and wellbeing? 

Several studies related to physiological and psychological changes show positive changes when people move from urban areas to rural environments. Evidence suggests that coastal habitats have been shown to improve our health, body, and mind (Garrett et al., 2019). However, it is unknown whether wetlands have the same psychological affects.

For that purpose, the Wildfowl and Wetlands Trust and Imperial College London undertook an innovative study with the primary goal to collect scientific evidence to demonstrate the importance of urban wetlands and social prescribing. The results suggest that urban wetlands improve the mood and increase the positive energy in all participants (Reeves et al., 2021). Even stressed participants showed a higher influence of wetland benefits (Reeves et al., 2021). The conclusion was that urban wetlands provide an opportunity to stop and reduce stress or bring individuals to ‘baseline’ (Reeves et al., 2021). By having a network of urban wetlands, people can quickly recharge and manage feelings such as stress, depression, and anxiety, as well as the added benefits for biodiversity and pollution control.     

Sources:

Environmental Protection Agency. (2015). Constructed wetlands for wastewater treatment and wildlife habitat. Environmental Protection Agency. Retrieved from https://www.epa.gov/sites/default/files/2015-10/documents/2004_10_25_wetlands_introduction.pdf.

Garrett, J.K., Clitherow, T.J., White, M.P., Wheeler, B.W., Fleming, L.E. (2019). Coastal proximity and mental health among urban adults in England: The moderating effect of household income. Health & Place, 59: 102200. Retrieved from https://doi.org/10.1016/j.healthplace.2019.102200.

Reeves, J.P., John, C.H.D., Wood, K.A., & Maund, P.R. (2021). A qualitative analysis of UK wetland visitor centres as a health resource. International Journal of Environmental Research and Public Health, 18(16): 8629. Retrieved from doi: 10.3390/ijerph18168629.

Ritchie, H. & Roser, M. (2018). Urbanization. Our World in Data. Retrieved from https://ourworldindata.org/urbanization#citation.

Wetlands Remediating Toxic Chemicals

What Are Wetlands?

Wetlands are ecosystems that are saturated with water year-round or for varying periods of time. These habitats provide numerous benefits ranging from ecological functions to societal benefits. Wetlands provide habitat for fish and wildlife, they have the ability to improve water quality, protect coastal shorelines from erosion, as well as their countless recreational opportunities. Wetland protection is an important topic that requires attention from environmentalists, governments, and individuals alike.

Chemistry of Wetlands

Wetlands consist of high quantities of organic matter, and in such environments, nitrogen limits microorganisms. When effluent from agricultural land passes through a wetland, the local microorganisms oxidize carbon using nitrate nutrients. As a result, the water that goes into lakes or oceans contains lower nitrate concentrations. Additionally, microorganisms break down or sequester many other organic and inorganic pollutants in the water. Wetlands have the ability to sequester iron sulfides which prevents acidification as a result of the reaction between iron sulfide and oxygen.

Toxic Chemicals in the Environment

Toxic chemicals are in use all around us: from pesticides to cosmetics and baby bottles to mobile phones. Various chemicals are released into the environment during the manufacturing process, which can travel vast distances by air and water. Currently, there are three types of chemicals are causing particular concern for human health and the environment:

  • Bioaccumulative chemicals: Extremely persistent chemicals that break down slowly and accumulate in both humans and animals.
  • Endocrine-disrupting chemicals (EDCs): These chemicals interfere with the hormone systems of animals and people.
  • Chemicals that cause cancer, reproductive problems, or damage DNA.

Why Should Chemicals Be Sustainable?

In order to ensure our overall well-being and to protect our health, as well as the environment, we need to pay special attention to the chemicals we use. Chemicals are the building blocks of low-carbon, zero pollution, energy- and resource-efficient technologies. Concurrently, chemicals can be hazardous and cause severe damage to human health and the environment. The entire process, from production to disposal of used products, avoiding the harmful properties of chemicals s. The ultimate goal is to create chemicals with the lowest possible impact on ecosystems and biodiversity.   

How Will We Achieve It?

Under certain conditions, any chemical can be toxic or harmful, which is why governments and agencies worldwide should implement strategies to reduce concentrations of chemicals released into the environment. The idea of a proposed strategy is to ensure that the chemicals are produced in a way that maximizes their contribution to society and the environment. Developed strategies force manufacturers to avoid more harmful chemicals for non-essential societal use. A toxic-free environment is a part of the European Commissions’ Zero Pollution Ambition for air, water, and soil. Their vision for 2050 is to reduce pollution levels to a level that is no longer considered harmful to health and natural ecosystems.

How Do Wetlands Filter Harmful Substances?

Every day, high amounts of harmful substances are introduced into water bodies, like streams, wetlands, rivers, and lakes. Households, farms, and other industries release toxic chemicals into our waterways. Such harmful substances negatively impact the wildlife and humans that live near these water bodies. Wetlands can reduce the amount of harmful substances as these ecosystems act as a strainer to filter out toxins.

When toxins enter a wetland, the vegetation can ‘catch’ the substances and store them into their roots. Before the toxins can be released to the water bodies downstream, the harmful substances become less concentrated. Another way toxic substances are remediated is through wetland soil catchment where microorganisms and other bacteria break the substances down.

Even though wetlands have the natural ability to filter pollutants, this does not mean harmful substances should be released without any control. Wetlands can handle a limited amount of substances and make certain substances less dangerous. Therefore, we all need to be responsible and cautious in disposing of harmful substances entering local waterways.   

Environmental Impact of Nuclear Activities: PART 2

Nuclear Testing Engenders Environmentalism

As mentioned in the previous article, the massive amounts of fallout released during the 1950’s are still present around the globe. Historian, Laura Bruno, describes in her article that the nuclear tests’ radioactive isotopes created and released as the “first environmental pollutant to take on the dimensions of a global threat.” She continues in her article that “as a result of fallout, scientists learned that pollutants could travel over long periods and distances, and that they could be accumulated in a reservoir in organic matter. This research revealed how interconnected different ecosystems are and led to the view that our global environment cannot tolerate endless pollutants” (Bruno, 2003).

Prior to World War II’s Manhattan Project and America’s effort to build an atomic bomb, there was limited knowledge on how radioactive particles were used in nuclear testing, how they spread, the persistence, the accumulation of radioisotopes, and how they would affect the environment.

The first systematic studies were likely made in 1943 at the Hanford plutonium plant. The Applied Fisheries Laboratory used x-rays to observe radioactive effects on salmon and trout in the Columbia River. Once the Hanford reactor began operating, samples were taken from the river which showed increased levels of radioactive material surrounding the plutonium plant (Anter, 2019). The laboratory traced several radioactive isotopes in water, which allowed them to develop a method to measure nuclear fallout.

The development of tools for analyzing fallout allowed different isotopes to be measured during the Cold War. These particles affected air, water, soil, plants, animals, and humans. Project Gabriel, commissioned by the Atomic Energy Commission (AEC) in 1949, sought to determine how many atomic bombs could be detonated without radioactive contamination to cause severe health effects from environmental contamination. Plutonium, strontium-90 (Sr-90), and yttrium-90 were the most dangerous isotopes released by fission weapons. Project Gabriel found that strontium-90 was the most hazardous resulting from nuclear detonations, due to the high amounts released into the atmosphere. Moreover, due to its similarity to calcium, living organisms could absorb it. In humans, this isotope accumulates in the bones and remains present in the body for several decades.

Following the discoveries made in Project Gabriel, Project Sunshine sought to determine the concentration and behavior of strontium-90 in the environment. The project’s report devoted substantial attention to methods of gathering their data from human remains, and concluded that there was a more pronounced accumulation of Sr-90 in adults, as infant bones have a faster growth rate. Project Sunshine, among other projects, was intended to remain classified from the public. However, when the project was leaked in 1953, the AEC received public backlash from the method in which they conducted this study. Upon the discovery of these research projects, the public started to become suspicious of the government’s assurances on the harmlessness of fallout. Citizens living near atomic test sites in the Nevada desert believed they experienced health disorders due to the fallout. 

As suspicions over the effects of fallout rose, a thermonuclear accident at the Bikini atoll in 1954 had worldwide significance. After the detonation of the Bravo device, the fallout cloud did not follow the predicted route due to the high winds. This allowed the fallout cloud to extend over a vast area outside the security zone. More than 250 individuals, including Marshallese, American military personnel, and Japanese fishermen, developed radiation sickness from the cloud. Some the severe cases of radiation sickness attracted public attention. The Japanese Ministry of Health and Welfare program discovered that 5% of fish caught after the cloud dispersed were too radioactive for consumption.

The Bikini incident and several other Pacific surveys raised public awareness of the harmful effects of fallout. It was discovered that even countries without an atomic program were affected by fallout. The fact that isotopes spread globally and are quickly introduced into the human food chain could no longer be kept a secret by AEC. This increased awareness and became the ground for the environmental movement (Bruno, 2003).

Weapons Testing and Climate Science

Climate science and nuclear weapon testing have a long-term and intertwined relationship. As a consequence of the Fukushima disaster, the Comprehensive Test Ban Treaty Organization tracked the radioactive plume emanating from damaged Japanese nuclear reactors. The global network of monitoring stations, a sophisticated model descendant of computer models created for testing fallout from weapon testing, successfully measured airborne radionuclides.

Over time, the methods of tracking radiation through the atmosphere have a practical application that extends far beyond the nuclear industry. For example, this method has been crucial for measuring anthropogenic climate change and tracing its major contributors. This includes measuring radioactive carbon and the way it cycles through the atmosphere, the oceans, and the biosphere. Some of the earliest global climate models relied on numerical methods similar to those developed by nuclear weapon designers. Even today, environmental scientists use mathematical models based on nuclear testing. Namely, these models have been created to predict and analyze the shock waves produced by nuclear explosions.

During the Cold War, the countries fighting for nuclear domination built facilities to create and test weapons. The labs in these facilities were equipped with powerful supercomputers with expertise in modeling and managing collected data sets to investigate the nuclear fallout. Today, they are used to observe climate change models. Researcher, Paul Edwards, states in his article that “the laboratories built to create the most fearsome arsenal in history are doing what they can to prevent another catastrophe – this one caused not by behemoth governments at war, but by billions of ordinary people living ordinary lives within an energy economy that we must now reinvent” (Edwards, 2012).

The impact of nuclear testing on the climate is another significant historical intersection between climate science and nuclear activities. Nuclear weapon designers have opened many possibilities to research and better understand the atmosphere. The knowledge about atmospheric carbon dioxide and its role in the greenhouse effect has helped both environmental scientists and political leaders understand the full extent of nuclear activities and the environmental damage caused by it.

Moratorium on Nuclear Testing

From 1945 until 1998, there were over 2000 nuclear tests conducted worldwide. Today, after thousands of detonations and irreparable damage in terms of human casualties and environmental damage, none of the world’s nuclear-armed states are conducting nuclear tests for the first time since the beginning of the nuclear age. In 1990, the Soviet Union proposed a moratorium on nuclear testing, and the United Kingdom and the United States agreed to a comprehensive ban on all nuclear testing. The last nuclear tests were conducted throughout the early 1990’s, after which, on 24 September 1996, 182 countries signed the Comprehensive Nuclear-Test-Ban Treaty (CNTBT).

Nuclear Activities Today

Despite the ratification of the CNTBT in several countries, several nuclear tests were conducted in North Korea, India, and Pakistan between 1998-2017. These countries broke the de facto moratorium that the CTBT had established with this action. India conducted two underground tests, with the government emphasizing that the explosions were for military testing. Pakistan reacted to India’s move by conducting two underground nuclear tests, after which both countries immediately announced unilateral moratoriums on nuclear testing and have conducted no nuclear tests since 1998. North Korea is the only country that has conducted nuclear tests in the 21st century. All tests were discovered by the Comprehensive Nuclear-Test-Ban Treaty verification regime. The regime is designed to detect any nuclear explosion on Earth – underground, underwater, or in the atmosphere. After determining North Korea’s compliance with the CTBT, the UN Security Council unanimously adopted sanction resolutions.

Sources:

Anter, S. (2019). 5 facts about Hanford. Colombia Riverkeeper. Retrieved from https://www.columbiariverkeeper.org/news/2019/8/5-facts-about-hanford

Bruno, L.A. (2003). The bequest of the nuclear battlefield: Science, nature, and the atom during the first decade of the Cold War. Historical Studies in the Physical and Biological Sciences, 33(2), 237-260. Retrieved from https://doi.org/10.1525/hsps.2003.33.2.237

Edwards, P.N. (2012). Entangled histories: Climate science and nuclear weapons research. Bulletin of the Atomic Scientists, 68(4), 28-40. Retrieved from DOI: 10.1177/0096340212451574

Environmental Impact of Nuclear Activities: PART 1

In the synergetic context of Cold War geopolitics and lack of effective international disarmament policies, countries like the United States, the USSR, the United Kingdom, France, and China became nuclear powers. From 1945 through 1964, many nuclear tests were conducted around the globe in all environments: the atmosphere, underground, and underwater. Participants in these activities carried out tests from onboard barges, on top of towers, suspended bombs from balloons, on the Earth’s surface, more than 600 meters underwater, and over 200 meters underground. The nuclear arms race marked the beginning of the atomic age. (1)

After several phases of banning nuclear arming of all states of the world through legislation like the Limited Test Ban Treaty of 1963 and the Non-Proliferation Treaty of 1968, a large number of nuclear weapons tests carried out in the atmosphere and underground between 1945-2013. These nuclear weapons tests are the main culprit for the current environmental contamination of radioactive waste. The extremely high levels of radioactivity resulted in ecologically and socially destroyed sites. (2)

According to statistical data provided by the Stockholm International Peace Research Institute, from 1945 to 2006, over 2053 nuclear tests were conducted worldwide. Of these tests, approximately 25% were completed in the atmosphere and 75% in the underground. When it comes to the energy released in nuclear explosions expressed in megatonnes (Mt) of TNT equivalent, there were two different processes involved: fission and fusion. In terms of radioactivity, the fission process produces a wide range of radionuclides. The fusion process generally only produces tritium (3H) but can also generate other radioactive materials responsible for large amounts of radioactive debris. Between 1951 and 1992, nuclear tests totaled an explosive yield of approximately 530 Mt. The atmospheric tests alone accounted for 428 Mt, equivalent to over 29,000 Hiroshima-sized bombs. (3)

Radioactive Pollution of the Atmosphere and Marine Environment

Approximately 90% of all nuclear tests were completed in the northern hemisphere and only about 10% in the southern hemisphere, making the northern hemisphere substantially more contaminated with the presence of large quantities of radioactive isotopes. In addition to nuclear weapons tests, nuclear power-plant accidents contribute to the northern hemisphere’s higher radioactivity. The horrific accidents at Chernobyl (1986) and Fukushima Daiichi (2011) released large amounts of radionuclides into the atmosphere.

Atmospheric nuclear weapons testing is another contributor to the direct release of radioactive materials into the environment. Such materials include the radionuclide 14C, which is created by nitrogen in the atmosphere and capturing the neutrons released in excess during nuclear tests. After forming, it is rapidly oxidized and transferred to the global carbon reservoirs (the atmosphere, the ocean, and the terrestrial biosphere), which is almost impossible to remove due to its extremely long half-life. (4)    

In a report published by the United Nations Scientific Committee, the committee states “the main man-made contribution to the exposure of the world’s population has come from the testing of nuclear weapons in the atmosphere, from 1945 to 1980. Each nuclear test resulted in unrestrained release into the environment of substantial quantities of radioactive materials, which were widely dispersed in the atmosphere and deposited everywhere on the Earth’s surface”(UNSCEAR, 1993).

Effects of Radionuclides and First Steps Towards Mitigation

Before 1950, very few considerations were given to the health impacts of nuclear weapon testing. Still, public protests in the 50s regarding the dispersion of radioactivity around the globe and concerns about the radionuclide strontium-90 and its effect on human health were crucial to the conclusion of the Partial Test Ban Treaty (PTBT) in 1963 (5).

After the nuclear testing encountered disapproval, governments signed the PTBT, with which all test detonations of nuclear weapons were prohibited, except for those conducted underground. Although this ban mitigated the adverse effects, there still were health problems arising from radiation doses from short-lived radionuclides released underground. (6)

Gradual Increase in Knowledge About the Dangers of Radiation Exposure

Over the past century, scientists gathered scientific evidence about the hazards of radioactivity. The gradual knowledge of the effects of radiation exposure was recognized from the conclusion that sufficient radiation dosage could cause injuries to internal organs, skin, and eyes. As stated in the 2000 Report of the United Nations Scientific Committee on the Effects of Atomic Radiation to the UN General Assembly, “radiation exposure can damage living cells, causing death in some of them and modifying others, and may eventually lead to cancer, and hereditary disorders may arise.” This report states: “Radiation exposure has been associated with most forms of leukemia and with cancers of many organs, such as lung, breast and thyroid gland” (UNSCEAR, 2000).

Long-Term Environmental Impact of Nuclear Testing 

There are several perspectives in analyzing the environmental impacts of nuclear testing. For example, from 1946 to 1996, over 300 tests were carried out in the Pacific Ocean. The long-term impact of these tests has been visible in through increased earthquakes, tsunamis, and other geological and hydrological effects. (7)

France conducted tests in Algeria between 1960-1966. Initially, it was considered that tests were conducted in the Algerian desert, but recently declassified military documents indicate that the tests were not restricted to the Saharan desert and had an impact on the entire continent of Africa, southern Spain, and Italy. International Atomic Energy Agency (IAEA) examined the test sites in Algeria 40 years after the tests were conducted and concluded that the “vegetation is scarce and only two plant samples could be collected“. (8) (10)

In the case of underground tests at In Ekker, Taourirt Tan Afella, a study conducted by IAEA found that long-term exposure might result from “external radiation in the vicinity of ejected lava, inhalation or ingestion of dust, ingestion of contaminated water, ingestion of contaminated food.” (9)  

Sources

  • 1.
    • Goodby, J. (2005). The Limited Test Ban negotiations, 1954–63: How a negotiator viewed the proceedings. International Negotiation, 10(3), 381–404. Retrieved from doi: 10.1163/157180605776087507.
    • Katz, JI. (2008). Lessons learned from nonproliferation successes and failures. Comparative Strategy, 27(5):426–430. Retrieved from doi: 10.1080/01495930802358398.
    • Schenck L.M. & Youmans, R.A. (2012). From start to finish: A historical review of nuclear arms control treaties and starting over with the new start. Journal of International & Comparative Law, 20(2), 399–435.
    • Prăvălie, R. (2014). Nuclear weapons tests and environmental consequences: a global perspective. Ambio, 43(6):729-44. Retrieved from doi: 10.1007/s13280-014-0491-1.
  •  2.
    • Comprehensive Nuclear-Test-Ban Treaty Organization. (1996). Comprehensive Nuclear-Test-Ban Treaty. CTBTO. Retrieved from https://www.ctbto.org/fileadmin/user_upload/legal/CTBT_English.pdf.
  • 3.
    • Fedchenko, V. & Hellgren, R.F. (2007). Appendix 12B: Nuclear explosions, 1945–2006. In Nuclear Arms Control and Non-proliferation. Retrieved from https://www.sipri.org/sites/default/files/YB07%20552%2012B.pdf.
    • United Nations Scientific Committee on the Effects of Atomic Radiation. (2000). Annex C: Exposures to the public from man-made sources of radiation. In UNSCEAR 2000 Report to the General Assembly: Sources and effects of Ionizing radiation. Retrieved from: https://www.unscear.org/docs/publications/2000/UNSCEAR_2000_Annex-C-CORR.pdf.
    • United Nations Scientific Committee on the Effects of Atomic Radiation. (1993). UNSCEAR 1993 Report: Sources and effects of ionizing radiation. UNSCEAR. Retrieved from https://www.unscear.org/docs/publications/1993/UNSCEAR_1993_Report.pdf.
  • 4.
    • Currie, K.L., Brailsforld, G., Nichol, S. et al. (2011). Tropospheric 14CO2 at Wellington, New Zealand: The world’s longest record. Biogeochemistry, 104, 5–22. Retrieved from doi: 10.1007/s10533-009-9352-6.
    • Grandin, K., Jagers, P., & Kullander, S. (2011) Nuclear energy. AMBIO, 39(1), 26–30. Retrieved from doi: 10.1007/s13280-010-0061-0.
    • United Nations Scientific Committee on the Effects of Atomic Radiation. (1993). Annex B: Exposures from man-made sources of radiation. In UNSCEAR 1993 Report: Sources and effects of ionizing radiation. Retrieved from: https://www.unscear.org/docs/publications/1993/UNSCEAR_1993_Report.pdf.
  • 5.
    • Reiss, L.Z. (1961). Strontium-90 absorption by deciduous teeth. Science, 134 (3491), 1669–1673. Retrieved from  doi: 10.1126/science.134.3491.1669
  • 6.
    • United Nations Office for Disarmament Affairs. (2017). Fact sheet: Disarmament and civil society. UNODA. Retrieved from https://front.un-arm.org/wp-content/uploads/2021/12/Disarmament-and-Civil-Society-Fact-Sheet-Jan2022.pdf
  • 7.
    • Comprehensive Nuclear-Test-Ban Treaty Organization. (n.d.). History of nuclear testing: World overview. CTBTO. Retrieved from https://www.ctbto.org/nuclear-testing/history-of-nuclear-testing/world-overview/.
  • 8 .
    • Comprehensive Nuclear-Test-Ban Treaty Organization. (n.d.). 13 February, 1960 – The first French nuclear test. CTBTO. Retrieved from https://www.ctbto.org/specials/testing-times/13-february-1960-the-first-french-nuclear-test/#:~:text=On%2013%20February%201960%2C%20France,the%20Sahara%20Desert%20of%20Algeria.
  • 9.
    • Burr, W. & Cohen, A. (eds). (2016). The Vela incident: South Atlantic mystery flash in September 1979 raised questions about nuclear test. National Security Archive. Retrieved from https://nsarchive.gwu.edu/briefing-book/nuclear-vault/2016-12-06/vela-incident-south-atlantic-mystery-flash-september-1979-raised-questions-about-nuclear-test.
  • 10.
    • International Atomic Energy Agency. (2005). Radiological conditions at the former French nuclear test sites in Algeria: Preliminary assessment and recommendations. International Atomic Energy Agency. Retrieved from https://www-pub.iaea.org/MTCD/Publications/PDF/Pub1215_web_new.pdf.

What Are Ocean Dead Zones?

What is a dead zone? 

Dead zones are low-oxygen areas of the world’s oceans or large lakes. These hypoxic areas have too little oxygen to supports marine life. Although the hypoxic zones are a natural phenomenon, many of the dead zones today are created or enhanced by human activities, and are increasing in shallow coastal and estuarine areas.

Dead zones created by nutrient pollution in bays, lakes, and coastal waters are the most common and problematic since they receive excess nutrients from upstream sources. Excess nitrogen and phosphorus lead to algae overgrowth in a short period of time. This overgrowth of algae consumes large amounts of oxygen and blocks sunlight from reaching underwater plants. Eventually, the algae will die, sink to the bottom of the water body, and the oxygen in the water is used for bacterial decomposition. Creating an oxygen sink and inhabitable conditions for aquatic life.

More harmful algae blooms can be wide-spanning and produce chemicals or toxins. Toxic blooms commonly occur in lakes, reservoirs, rivers, ponds, bays, and coastal waters. In most cases, cyanobacteria, also known as blue-green algae, is the cause of harmful algae blooms. The toxins produced by cyanobacteria can harm both human health and aquatic life.

How can dead zones form? 

Eutrophication is the main driver of dead zone formation. As a result of human activities, nitrogen levels are almost doubled, and phosphorus levels are tripled compared to the natural values of these substances that flow into the environment. This has been attributed to the increased use of nitrogen and phosphorous fertilizers, nitrogen fixation by leguminous crops, and atmospheric deposition of oxidized nitrogen from the combustion of fossil fuels (Dybas, 2005). Additionally, some of the nutrient sources found in coastal waters are lawn fertilizers, agricultural manure, sewage output, and stormwater. The amount of nutrients found in nature was limited, however, as human activities have increased, nutrient pollution has lead to massive algal blooms and, ultimately, dead zones. Harmful algal blooms can lead to fish kills, contaminated drinking water, shellfish poisoning, and the death of marine mammals and shore birds.

Another factor contributing to the formation of dead zones is water column stratification due to the difference in water density. For instance, in the Gulf of Mexico, eutrophication initiates a massive phytoplankton growth on the water’s surface. The size of this plankton population surpasses the natural capacity of consumers to graze it down to a balanced level. After their relatively short lifespan, the plankton die and sink to the bottom waters, where bacteria decomposition occurs. During the summer months, the water column is stratified from the limited mixing from wind and wave energy. Additional environmental factors (i.e. temperature and salinity) create stratified layers of water from top to bottom. Freshwater flowing from rivers and the warmed surface water have low density which forms a layer above the cool, dense seawater near the bottom. This stratification leaves the bottom layer isolated from the regular resupply of oxygen from the atmosphere. Organisms capable of swimming have the ability to escape the dead zone, but sessile fauna experience stress or die (NOAA, n.d.).

Categorizing Eutrophic Systems: Where are dead zones? 

Scientists have identified 415 dead zones worldwide. Over the years, there has been a staggering increase in the number of dead zones at a global level. In 1960 there were about 10 documented cases, and in less than 50 years, the number dramatically increased to 169 in 2007. A majority of the dead zones are located along the eastern coast of the United States and the coastlines of the Baltic States, Japan, and the Korean Peninsula.

Considering the dramatic increase in dead zones, scientists have prioritzed coastal systems experiencing any symptoms of eutrophication. Namely, a coastal system that exhibits the effects of eutrophication is considered an area of concern. These areas are at the most significant risk of developing hypoxia. There are 233 areas of concern along the western coast of Central and South America and the coastlines of Great Britain and Australia.

Despite the increasing amount of dead zones in our waters, there are systems in recovery from hypoxia. For example, the Black Sea is a system that once experienced yearly hypoxic events, but is now in a state of recovery and improvement. Similarly, Boston Harbor in the United States and the Mersey Estuary in the United Kingdom have improved water quality.

The Largest Dead Zone in the World

The number of dead zones and their size and exact location varies each year. The overall area of dead zones across the world is estimated to be at least 1,544,263 square miles, an area equal to the size of the European Union (Loyd-Smith & Immig, 2018). The largest dead zones are the Gulf of Oman – 63,700 square miles, the Baltic Sea – 27,027 square miles, and the Gulf of Mexico – 6,952 square miles (Carstensen & Conley, 2019; NOAA, 2019; Queste et al., 2018).

The Impact of Dead Zones

In addition to the environmental impact, dead zones have a negative effect on the economy. For fishermen who rely on the ocean to provide a livelihood, dead zones mean they have to travel greater distances from shores to find areas where fish congregate. This is impossible for small boats, and there is added cost for fuel and staff members. According to NOAA estimations, dead zones cost the U.S. seafood and tourism industries approximately $82 million annually.

What are the solutions?

Reducing nutrient pollution and keeping fertilizers on land and out of coastal water is the primary goal of lowering dead zones. And the best way to accomplish that is through cooperation at the international level. The ecosystems in the world’s oceans are fragile. Increasing hypoxia and dead zones, warming oceans, and rising acidification create multiple stressors to marine ecosystems.  

Sources:

Carstensen, J. & Conley, D. J. (2019). Baltic Sea hypoxia takes many shapes and sizes. Bulletin of Limnology and Oceanography, 28(4), 125-129. Retrieved from doi:10.1002/lob.10350.

Dybas, C.L. (2005). Dead zones spreading in world oceans. BioScience, 55(7), 552–557. Retrieved from https://doi.org/10.1641/0006-3568(2005)055[0552:DZSIWO]2.0.CO;2

Lloyd-Smith, M. & Immig, J. (2018). Ocean pollutants guide: Toxic threats to human health and marine life. IPEN. Retrieved from https://ipen.org/sites/default/files/documents/ipen-ocean-pollutants-v2_1-en-web.pdf

NOAA. (2019). Large ‘Dead Zone’ measured in Gulf of Mexico. National Oceanic and Atmospheric Administration. Retrieved from https://www.noaa.gov/media-release/large-dead-zone-measured-in-gulf-of-mexico

NOAA. (2011). Congressional interest in harmful algae and dead zone bill prompts hearing. National Centers for Coastal Ocean Science. Retrieved from https://coastalscience.noaa.gov/news/cscor-provides-testimony-to-congress-in-support-of-harmful-algae-and-hypoxia-law/

NOAA. (n.d.). Operational Gulf of Mexico hypoxia monitoring. National Centers for Coastal Ocean Science. Retrieved from https://coastalscience.noaa.gov/project/operational-gulf-of-mexico-hypoxia-monitoring/

Queste, B. Y., et al. (2018). Physical controls on ocean distribution and denitrification potential in the north west Arabian Sea. Geophysical Research Letters, 45(9), 4143-4152. Retrieved from doi:10.1029/2017GL076666.