Rock Quarry Shut Down for Filling Wetland

Source: Front Page Africa (2023)

The Environmental Protection Agency of Liberia has shut down the Fengshou International rock quarry for backfilling the Marshall wetlands in Sheliflin Town. The firm that owns the quarry, Eastern International, has been cited with several violations under the Liberian Environmental Protection and Management Law (EMPL) and the company’s environmental permit.

Environmental Law and Permit Violations

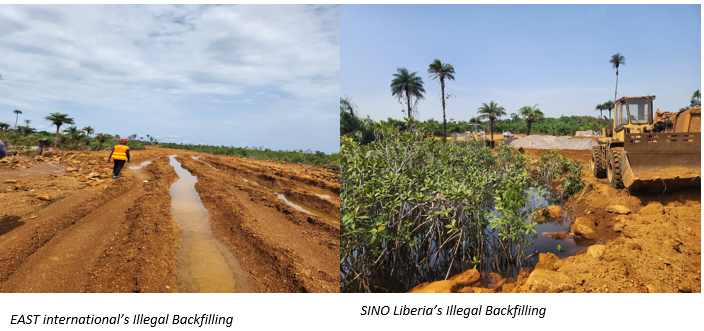
The quarry was built for Eastern International to conduct its reconstruction project of the Roberts International Airport Highway. Dredging and filling the surrounding wetlands was not included in the scope of the environmental permit issued for the operation of the rock quarry. The firm applied for an additional permit to construct an access road through the Marshall wetlands from the quarry to the highway. In October 2022, the EPA conducted an environmental assessment for the prospective permit and determined the project would not be feasible without causing degradation to the wetlands. The permit was then denied, and the company was urged to abstain from building the road. Against the assessment of the EPA, Eastern International filled in the wetland to construct the access road.

Eastern International has been cited for non-compliance under their environmental permit and violation of Section IV: Part 75 under the EMPL. Unless the firm restores the wetland to its original condition, they could be subject to a $5,000 fine or imprisonment for at least two years. Director of the Liberian EPA, Wilson Tarpeh, stated the company neglected to conduct an Environmental Social Impact Assessment. This is an important compliance procedure that is integral to Liberia’s contribution to the Ramsar Convention.

Ramsar Wetlands

The wetlands in question were designated as a Ramsar wetland in 2006; thereby heightening the severity of the environmental consequences. In 1971, the Ramsar Convention agreement was signed by eighteen nations to recognize the ecological importance of wetlands and promote the wise use of wetlands worldwide. The Ramsar organization has made impressive strides in wetland conservation through its Wetlands of International Importance initiative (Ramsar sites). In signing the agreement, each signatory nation is required to designate at least one wetland as a Ramsar site. These wetlands are determined to be sites of social and ecological significance to the respective nation. As a fellow signatory of the Ramsar Convention, Liberia has designated five sites, including the Marshall wetlands

Current Status

On January 4, 2023, Wilson Tarpeh issued an order to shut down the production of the rock quarry. The order will remain in place until the wetlands are fully restored and approved by the EPA. It is currently unknown how this will impact the Marshall wetlands’ status as a Ramsar site or the nature of Ramsar’s involvement in this issue.

Sources

Front Page Africa. (2023). Liberia: EPA Shuts Down East Int’l, Sino Liberia Rock Quarry for Massively Backfilling Wetland in Marshall. Retrieved from https://frontpageafricaonline.com/news/liberia-epa-shuts-down-east-intl-sino-liberia-rock-quarry-for-massively-backfilling-wetland-in-marshall/

Ramsar. (n.d.). Wetlands of International Importance. Ramsar. Retrieved from https://www.ramsar.org/sites-countries/wetlands-of-international-importance

Ordinary High Water Mark Delineation Manual

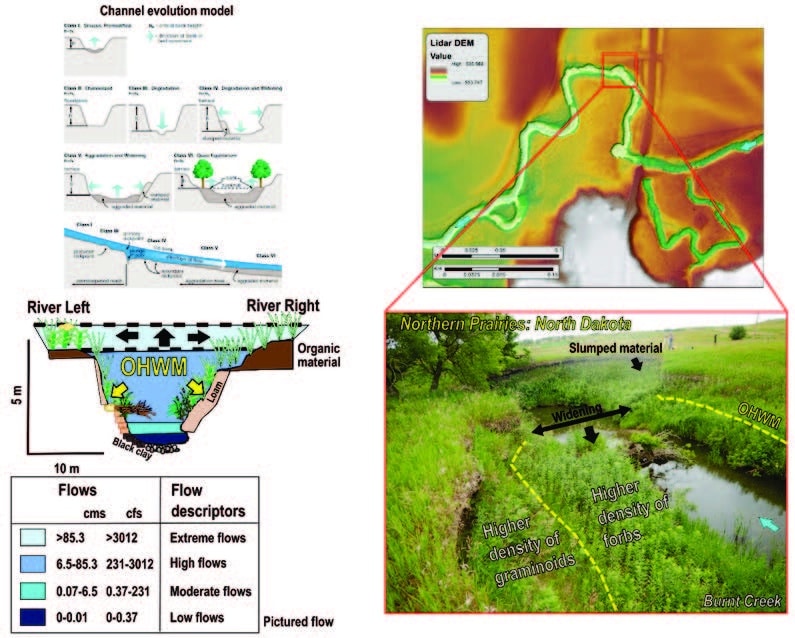
The U.S. EPA and the U.S. Army Corps of Engineers have issued an interim manual for delineation the National Ordinary High Watermark for rivers and streams. The ordinary high water mark (OHWM) defines the lateral extent of non-tidal aquatic features in the absence of adjacent wetlands in the United States. The Interim Draft of the National OHWM Manual provides draft technical guidance for identifying aquatic resources that may be subject to regulatory jurisdiction under Section 404 of the Clean Water Act (CWA) and/or Sections 9 and 10 of the Rivers and Harbors Act of 1899 (RHA), by providing a standard process, uniform datasheets, and unified field procedures to identify and delineate the OHWM of rivers and streams.

This is the first manual to present a methodology for nationwide identification and delineation of the OHWM. The manual provides a process for identifying the OHWM using stream characteristics observed in the field; it also provides information on how to use other lines of evidence to support field delineations. A data sheet and field procedure are included to guide users through the step-by-step process of identifying the OHWM. It also describes regional differences and challenges in identifying the OHWM at sites disturbed by human-induced or natural changes and illustrates how to use remote data to structure field inquiries and interpret field evidence using the principles of fluvial science. The manual demonstrates that, in many landscape settings, the OHWM may be located near the bankfull elevation. 

The public and practitioners are encouraged to test and provide comments on their experience using the Interim Draft National OHWM Manual. Comments on the Interim Draft National OHWM Manual should be submitted by email to usace.ohwm@usace.army.mil. Written comments may also be provided by mail to Mr. Matt Wilson, U.S. Army Corps of Engineers, Attn: CECW-CO-R, 441 G Street NW, Washington, DC 20314-1000. The one-year comment period ends on December 1, 2023.

Links for the Manual and Data Forms:

ERDC Knowledge Core: National Ordinary High Water Mark Field Delineation Manual for Rivers and Streams : Interim Version (dren.mil)

INTERIM DRAFT RAPID ORDINARY HIGH WATER MARK (OHWM) FIELD IDENTIFICATION DATA SHEET (defense.gov)

Ordinary High Water Mark (OHWM) Research, Development, and Training > Engineer Research and Development Center > Fact Sheet Article View (army.mil)

Sources

U.S. Army Corps of Engineers & U.S. Environmental Protection Agency. (2022). Notice of Availability of the Interim Draft of the National Ordinary High Water Mark Field Delineation Manual for Rivers and Streams. https://usace.contentdm.oclc.org/utils/getfile/collection/p16021coll15/id/756

Press Release: EPA and Army Finalize Definition of WOTUS

Background

On June 9, 2021, EPA and the Department of the Army announced their intent to revise the definition of “waters of the United States” to better protect our nation’s vital water resources that support public health, environmental protection, agricultural activity, and economic growth. On Nov. 18, 2021, the agencies announced the signing of a proposed rule revising the definition of “waters of the United States.”

The Clean Water Act prohibits the discharge of pollutants from a point source into “navigable waters” unless otherwise authorized under the Act. “Navigable waters” are defined in the Act as “the waters of the United States, including the territorial seas.” Thus, “waters of the United States” is a threshold term establishing the geographic scope of federal jurisdiction under the Clean Water Act. The term “waters of the United States” is not defined by the Act but has been defined by the agencies in regulations since the 1970s and jointly implemented in the agencies’ respective programmatic activities.

Press Release

The U.S. Environmental Protection Agency (EPA) and the U.S. Department of the Army (the agencies) announced a final rule establishing a durable definition of “waters of the United States” (WOTUS) to reduce uncertainty from changing regulatory definitions, protect people’s health, and support economic opportunity. The final rule restores essential water protections that were in place prior to 2015 under the Clean Water Act for traditional navigable waters, the territorial seas, interstate waters, as well as upstream water resources that significantly affect those waters. As a result, this action will strengthen fundamental protections for waters that are sources of drinking water while supporting agriculture, local economies, and downstream communities.

“When Congress passed the Clean Water Act 50 years ago, it recognized that protecting our waters is essential to ensuring healthy communities and a thriving economy,” said EPA Administrator Michael S. Regan. “Following extensive stakeholder engagement, and building on what we’ve learned from previous rules, EPA is working to deliver a durable definition of WOTUS that safeguards our nation’s waters, strengthens economic opportunity, and protects people’s health while providing greater certainty for farmers, ranchers, and landowners.”

“This final rule recognizes the essential role of the nation’s water resources in communities across the nation,” said Assistant Secretary of the Army for Civil Works Michael L. Connor. “The rule’s clear and supportable definition of waters of the United States will allow for more efficient and effective implementation and provide the clarity long desired by farmers, industry, environmental organizations, and other stakeholders.”

This rule establishes a durable definition of “waters of the United States” that is grounded in the authority provided by Congress in the Clean Water Act, the best available science, and extensive implementation experience stewarding the nation’s waters. The rule returns to a reasonable and familiar framework founded on the pre-2015 definition with updates to reflect existing Supreme Court decisions, the latest science, and the agencies’ technical expertise. It establishes limits that appropriately draw the boundary of waters subject to federal protection.

The final rule restores fundamental protections so that the nation will be closer to achieving Congress’ goal in the Clean Water Act that American waters be fishable and swimmable, and above all, protective of public health. It will also ensure that the nation’s waters support recreation, wildlife, and agricultural activity, which is fundamental to the American economy. The final rule will cover those waters that Congress fundamentally sought to protect in the Clean Water Act—traditional navigable waters, the territorial seas, interstate waters, as well as upstream water resources that significantly affect those waters.

More information, including a pre-publication version of the Federal Register notice and fact sheets, is available at EPA’s “Waters of the United States” website.

Accompanying the issuance of the final rule, the agencies are also releasing several resources to support clear and effective implementation in communities across America. Today, a summary of 10 regional roundtables was released that synthesizes key actions the agencies will take to enhance and improve implementation of “waters of the United States.” These actions were recommendations provided during the 10 regional roundtables where the agencies heard directly from communities on what is working well from an implementation perspective and where there are opportunities for improvement. The roundtables focused on the geographic similarities and differences across regions and provided site specific feedback about the way the scope of “waters of the United States” has been implemented by the agencies.

Today, the agencies are also taking action to improve federal coordination in the ongoing implementation of “waters of the United States.” First, EPA and Army are issuing a joint coordination memo to ensure the accuracy and consistency of jurisdictional determinations under this final rule. Second, the agencies are issuing a memo with U.S. Department of Agriculture to provide clarity on the agencies’ programs under the Clean Water Act and Food Security Act.

Sources:

Environmental Protection Agency. (2022, December 30). EPA and Army finalize rule establishing definition of WOTUS and restoring fundamental water protections [Press release]. https://www.epa.gov/newsreleases/epa-and-army-finalize-rule-establishing-definition-wotus-and-restoring-fundamental

Establishing Biological Benchmarks

A biological benchmark is a concept I first ran into while working in the Chesapeake Bay region. They are used in shoreline restoration projects that use native materials, often called living shorelines or vegetative erosion control.

The concept of biological benchmarks is based upon empirical data and direct observation of natural plant communities. The issue relates to specific hydroperiods that the native plants can tolerate. This results in an establishment of a given plant community based upon a frequency and duration of inundation by water. Many plant species have highly specific hydroperiod tolerances that can be measured in the field and extrapolated elsewhere.

The best example of plants with highly specific hydroperiods are represented by the coastal Spartina genus. Two of the Spartina species include Spartina alterniflora (cordgrass) and Sparitna patens (salt hay). Both species occur in the intertidal zone and are found all along the east coast and the Chesapeake Bay. They are salt marsh grasses that tolerate salt water.

What makes the two species of Spartina unique is that they only grow in two very distinct regions of the intertidal zone. S. alteniflora is found between mid-tide (MT) and extends up to mean high water (MHW). S. patens picks up from there and occurs between mean high water (MHW) and mean high high water (MHHW), or spring tide. What is amazing about this is that both species do not vary more than 0.1 feet in elevation from these tidal zones. They are very precise about where they will live.

To establish our biological benchmarks, we need to make sure that our study area is not under any major stress. This mostly comes in the form of bank erosion and herbivory. If either of these is excessive the area may not yield accurate results. I also use a fetch rule of thumb. Fetch is the distance from the shoreline across open water. This is measured perpendicular to the shoreline. If the fetch is more than one (1) mile, I do not consider the site suitable for further study. The wave action is just too great. High boat traffic can also be a problem. What usually happens in this circumstance is that my mid tide elevation is missing.

Once we have satisfied the disturbance issue we can start measuring. We need to take several elevation shots using a level of the extreme limits of both the S. alterniflora and S. patens. This is usually done using a laser level. First, establish and back site a site benchmark. Get your instrument height and then you are ready to start measuring fore site elevations. Each fore site shot should be corrected and converted based upon the site benchmark.

You should see a consistent range of elevations that can be extrapolated to MT, MHW and MHHW. This can be cross checked against the published tide tables for your region. If you have a two (2) foot tide range, then the elevation change from MT to MHW should be one (1) foot in height. The presence of the cordgrass should confirm this.

You may ask why all the bother if we have the tide tables? The answer relates to tidal restrictions and local variations. The tide tables will tell you what the exact elevation is at a given tide gauge. However, in survey terms you would need to drag that control across the water to your site. If there are no restrictions and you are close to the gauge you may be able to do this. However, one bridge or culvert between you and the gauge can have a dramatic effect on the tidal exchange.

I had a project in upstate New York on the Hudson River that had a major problem with tidal restrictions. It was a freshwater tidal marsh and had about a 1.5-foot tidal exchange at the gauge near West Point, NY. The gauge was across the river but close by. The marsh restoration designers had based their plant species selection and placement based upon the use of the gauge. Unfortunately, they missed the fact that there was a railroad crossing bridge between the marsh and the river. The bridge impinged the tidal flow into and out of the marsh by close to a foot. The result was that the tidal exchange inside the marsh was about 0.75 feet rather than the calculated 1.5 feet. Now this may not sound like a significant difference, but it would result in the marsh planting being placed about a foot above the waterline. This would be bad as the plants were all emergent species and required frequent inundation.

Biological benchmarks saved the day. We were able to establish the proper elevation for the new marsh based upon the observed limits of a few selected freshwater tidal species. There is a species of Typha that is unique to the region that served as a great biological benchmark indicator species. The result was the design was lowered by about a foot and all the plants were happy. The trick to all of this is the need to understand what the plants require. Once you understand what the plants need, the rest falls into place.

Wetland Resilience in a Changing World

When it comes to wetlands as ecosystems, resilience is a concept that describes ecosystems’ capacity to persist in their present state when facing natural forces such as droughts, floods, and wildfires. In some cases, resilience refers to the rate at which the ecological system has the ability and capacity to return to its equilibrium. Wetlands have the natural capacity to manage change, regardless of whether water level changes, temperature changes, chemistry, or other factors might impact the overall wetland condition.

Wetlands are precious resources that provide essential ecosystem services to communities. Many scientists and ecologists agree that wetlands provide disproportionately more ecosystem services than other ecosystems. Wetlands filter out the sediments, nutrients, and other harmful pollutants to humans. They can capture, store, and slowly release stormwater runoff and snowmelt. This slows down the water flow, reduces the flood peaks, increases infiltration, and provides a steady source of base flow to lakes and streams. Additionally, wetlands are habitats for many fish species, which are essential economic assets and support plants and wildlife, making the wetlands an ideal place for recreation.

Despite their natural benefits, wetlands are still vulnerable to changes in landscapes and the weather patterns resulting from climate change. Even the slightest imbalance in the narrow hydrological ‘bandwidth,’ such as too much or too little water, can have immense consequences for wetlands. Sediments, nutrients, invasive species, and other inputs arising from landscape changes can impair wetlands’ ability to provide resiliency. Extreme weather events due to climate change, including increased sea level, unplanned land-use practices and alterations, and super-fast urbanization, directly impact the wetlands. These ecosystems are threatened worldwide, and all factors can potentially lead to a cascade of ecological consequences, such as acidification, harmful algae blooms, hypoxia, contamination of drinking water aquifers, and loss of biodiversity.

Opinion: Could Cattle Farming Protect Wetlands?

As previously mentioned, wetlands provide numerous benefits, including economic benefits, and support the resiliency of our agricultural landscapes. Wetlands have an astounding ability to sequester carbon and filter water, support pollinators and biodiversity, and provide wildlife habitat, including many endangered species. Humans can use these benefits in a rationally and environmentally friendly way. Approximately 25 % of the world’s wetlands are found in Canada.

Farmers are among those who experience the adverse effects of climate change daily. Concurrently, this group of individuals commonly receives a substantial amount of blame for the changing climate. Still, in Canada, farmers and ranchers possess some of the most promising solutions to climate mitigation. Raising cattle helps in the preservation of wetland ecosystems. In Canada, the landscape is suitable for raising beef cattle while supporting natural systems. With proper management and strategies, cattle farming can successfully co-exist and provide environmental co-benefits to ecosystems like wetlands.

More and more cattle farmers are becoming aware of new farming methods and are investing in their business to protect wetlands. Some of these measures include solar-powered water troughs and strategic cattle movement at certain times of the year. This has positive benefits for both ranchers and nature: habitat preservation is crucial for the health and the vitality of the land and animals, and it is fundamentally connected with the sustainability of their business.

The overlapping uses of growing food and conservation are assets that need to be valued and responsibly managed. To conserve nature, farmers must nature to use the lands responsibly and with an appreciation of their invaluable worth. Farmers from across the globe need to start applying these techniques and support the resiliency of the landscapes long into the future.

Sources:

Bhattachan, A. et al. (2018). Sea level rise impacts on rural coastal social-ecological systems and the implications for decision making. Environmental Science and Policy, 90, 122-134. https://doi.org/10.1016/j.envsci.2018.10.006

Chescheir, G.M., Skaggs, R.W., Gilliam, Wendell, & Broadhead, R. (1991). Hydrology of two forested wetlands that receive pumped agricultural drainage water in Eastern North Carolina. Wetlands, 11, 29-54. http://dx.doi.org/10.1007/BF03160839

Heffernan Lab. (n.d.). Wetland resilience and self-organization. Duke University. https://heffernanlab.weebly.com/wetland-resilience.html

Matson, P.A., Parton, W.J., Power, AG, & Swift, M.J. (1997). Agricultural intensification and ecosystem properties. Science, 277(5325), 504-509. https://doi.org/10.1126/science.277.5325.504

Ribaudo, M., Delgado, J., Hansen, L., Livingston, M., Mosheim, R., & Williamson, J. (2011). Nitrogen in agricultural systems: Implications for conservation policy. United States Department of Agriculture Economic Research Service. 10.2139/ssrn.2115532.

Tapley, K. (2022). Opinion: Wetlands and resilient landscapes. A match made in Canada. Canadian Cattlemen. https://www.canadiancattlemen.ca/news/opinion-wetlands-and-resilient-landscapes-a-match-made-in-canada/

Nature-Based Solutions Roadmap

The Biden-Harris Administration released their recommendations “roadmap” to the National Climate Task Force with the intention of accelerating the use of nature-based solutions (NBS) in the United States. The roadmap stems from the 2021 Bipartisan Infrastructure Law and Inflation Reduction Act and Executive Order 14072, which directed Federal agencies to identify opportunities to expand the implementation of natural and nature-based solutions. The administration announced its plan to expand nature-based solutions at the 2022 United Nations Climate Change Conference. They are planning to allocate about $25 million in infrastructure and climate funding to support integrating nature-based solutions.

What are Nature-Based Solutions?

The White House defines nature-based solutions as “actions to protect, sustainably manage, or restore natural or modified ecosystems to address societal challenges, simultaneously providing benefits for people and the environment”. Best management practices (BMPs) act as a vehicle for achieving the broad principles of nature-based solutions. There are several types of BMPs that are used to mimic natural processes like permeable pavement, greenways, rain gardens, and constructed wetlands.

Wetlands and Nature-Based Solutions

Wetlands and their functions can be applied to several different nature-based solutions. The roadmap cites a wetland’s ability to reduce greenhouse gas emissions through wetland conservation, improve inland flooding, capture and treat stormwater runoff through constructed wetlands, and restore community culture through recreational activities. A common nature-based solution used to protect coastal and freshwater wetlands from shoreline erosion and storm surge are living shorelines. Living shorelines are structures comprised of natural materials like rocks, plants, and sand that act as protection for shorelines. They are often used in place of hardened structures like sea walls or jetties.

The Goals of the Roadmap

The Administration finds nature-based solutions to be the key to improving climate change and environmental inequities. To combat climate change, the administration proposes that the increased use of nature-based solutions can reduce greenhouse gas emissions and increase rates of carbon sequestration. In their recommendation, they state conserving and restoring critical habitats like grasslands, forests, and wetlands will contribute to one-third of the climate mitigation required to reduce global warming below 2 degrees Celsius by 2030. Environmental inequity plays directly into improving the effects of climate change as at-risk communities experience climate change at a disproportionately higher rate. In their roadmap, the White House makes a point to utilize nature-based solutions as methods to mitigate environmental justice issues and prevent further inequities.

Strategy and Challenges Ahead

To accomplish their goal, the Biden-Harris Administration suggested five strategies and recommendations for Federal agencies to adopt in their practices. The five action areas in their roadmap are:

1. Update Policies to Accelerate Nature-Based Solutions
2. Unlock Funding for Nature-Based Solutions
3. Lead with Federal Facilities and Assets
4. Train the Nature-Based Solutions Workforce
5. Prioritize Research, Innovation, Knowledge, and Adaptive Learning

While the Administration is hopeful to implement nature-based solutions, they identified potential roadblocks that would hinder the widespread use of nature-based solutions. In their note, they identified their main challenges as:

  • Insufficient awareness of nature-based solutions
  • Regulatory and policy hurdles
  • Difficulty accounting for cost and benefits
  • Insufficient and uncoordinated funds
  • Limited federal, community, and workforce skills and knowledge
  • Gaps in evidence of effectiveness

It will be interesting to see how well these nature-based solutions are incorporated into Federal agencies and future policies over the next two years. To learn more about the Administration’s recommendations, please refer to the roadmap here: https://www.whitehouse.gov/wp-content/uploads/2022/11/Nature-Based-Solutions-Roadmap.pdf

Point Intercept Sampling Procedure

Just how accurate are vegetation inventories? Currently, we are allowed to conduct a visual estimate of percent cover of a given plant species. Based upon the 2020 US Army Corps of Engineers National Wetland Plant List we can determine whether a site has a hydrophytic plant community. Two issues arise from this methodology. The first of course is the proper identification of the plant species. Most wetland biologists put forth a tremendous effort in trying to correctly identify both the genus and species of a given plant. However, the second issue is the estimate of percent cover. This is highly subjective and prone to large error.

The procedure for determining percent cover is a simple guesstimate of looking up into the sky and estimating how much cover each species occupies. Similarly, we also look downwards and estimate the aerial cover of smaller species. The problem lies in the fact that it’s a guess. If you were to have a dozen wetland biologists on a given site, I can almost guarantee that you will have a dozen sets of data. The problem is exasperated by the fact that it is entirely possible for one group of individuals to identify a plant community as being hydrophytic and another group looking at the exact same plant community and find it to be an upland community.

How is this possible? Well quite simply the problem lies in the data collection itself. The current methodology can have variances up to 40%. If you were to go to court and had to defend your data what would be your comfort level given this type of variance?

Fortunately, the US Army Corps of Engineers has published another plant collection methodology. Buried deep in the back of the regional supplements in Appendix B is a procedure called the point intercept sampling method. This procedure is highly accurate and can have a variance of less than 2% among numerous data collectors. As you might suspect it takes a bit longer to do this type of procedure, but the data is rock solid. The following procedure is taken directly from US Army Corps of Engineers regional supplements for wetland delineations. It is highly recommended that you consider incorporating this procedure into your routine wetland delineation methods. As part of our wetland delineation programs, we offer training using this methodology.  Please review the methodology outlined below and let us know your comments.

Appendix B: Point-Intercept Sampling Procedure for Determining Hydrophytic Vegetation

The following procedure for point-intercept sampling is an alternative to plot-based sampling methods to estimate the abundance of plant species in a community. The approach may be used with the approval of the appropriate Corps of Engineers District to evaluate vegetation as part of a wetland delineation. Advantages of point-intercept sampling include better quantification of plant species abundance and reduced bias compared with visual estimates of cover. The method is useful in communities with high species diversity, and in areas where vegetation is patchy or heterogeneous, making it difficult to identify representative locations for plot sampling. Disadvantages include the increased time required for sampling and the need for vegetation units large enough to permit the establishment of one or more transect lines within them. The approach also assumes that soil and hydrologic conditions are uniform across the area where transects are located. Transects should not cross the wetland boundary. Point-intercept sampling is generally used with a transect-based prevalence index (see below) to determine whether vegetation is hydrophytic.

In point-intercept sampling, plant occurrence is determined at points located at fixed intervals along one or more transects established in random locations within the plant community or vegetation unit. If a transect is being used to sample the vegetation near a wetland boundary, the transect should be placed parallel to the boundary and should not cross either the wetland boundary or into other communities. Usually, a measuring tape is laid on the ground and used for the transect line.  Transect length depends upon the size and complexity of the plant community and may range from 100 to 300 ft. (30 to 90 m) or more. Plant occurrence data are collected at fixed intervals along the line, for example every 2 ft. (0.6 m). At each interval, a “hit” on a species is recorded if a vertical line at that point would intercept the stem or foliage of that species. Only one “hit” is recorded for a species at a point even if the same species would be intercepted more than once at that point. Vertical intercepts can be determined using a long pin or rod protruding into and through the various vegetation layers, a sighting device (e.g., for the canopy), or an imaginary vertical line. The total number of “hits” for each species along the transect is then determined. The result is a list of species and their frequencies of occurrence along the line (Mueller-Dombois and Ellenberg 1974, Tiner 1999). Species are then categorized by wetland indicator status (i.e., OBL, FACW, FAC, FACU, or UPL), the total number of hits determined within each category, and the data used to calculate a transect-based prevalence index. The formula is similar to that given in Chapter 2 for the plot-based prevalence index (see Indicator 3), except that frequencies are used in place of cover estimates. The community is hydrophytic if the prevalence index is 3.0 or less. To be valid, more than 80 percent of “hits” on the transect must be of species that have been identified correctly and placed in an indicator category.

The transect-based prevalence index is calculated using the following formula:

PI = FOBL + 2FFACW + 3FFAC + 4FFACU + 5FUPL

FOBL + FFACW + FFAC + FFACU + FUPL

where:

PI = prevalence index

FOBL   = frequency of obligate (OBL) plant species;

FFACW = frequency of facultative wetland (FACW) plant species;

FFAC   = frequency of facultative (FAC) plant species;

FFACU   = frequency of facultative upland (FACU) plant species;

FUPL   = frequency of upland (UPL) plant species.

The Resurgence of Fracking

If you have ever watched the movie, “Monty Python and the Holy Grail,” you will remember the scene where a man is coming down the street yelling, “Bring out yer dead!,” to which a person on the cart exclaims, “I’m not dead yet.”  Well, the same could be said about fracking. From the fracking boom of just a few years ago, we see many wells being capped off and new wells not being drilled. What happened?

To quash the nascent US fracking industry, OPEC+ increased output to lower the price of oil but found they could not maintain those prices forever. Fracking became more efficient and hung on. OPEC+ was finally forced to raise prices back up, with prices stabilizing in the $60/bbl. range. Then, in 2019, the COVID pandemic hit, and its repercussions dominated 2020. Oil demand waned and oil companies began tightening their collective belts. But it may be time to start ramping up production once again.

Hydraulic fracturing in Texas, North Dakota, and most recently, the Marcellus region in Pennsylvania, has turned the US into a net energy exporter. Fracking is one of the main reasons that the US became the world’s largest oil producer, producing over 18,875,000 bpd and fracking may be getting an invigorating boost from several unrelated sources.

The unprecedented attack on Ukraine by Russia and the ensuing conflict has caused many countries, primarily those in Europe, to rethink their commitments to buying Russian oil and gas. As more countries, including the US, pull out of their deals with Russia, countries are scrambling to find alternative energy sources. While this may be a boon for renewable energy in the long run, in the short run, alternative sources of oil and gas are frantically being sought out to make up for shortfalls in Europe to prepare for the rapidly approaching winter months.

The U.S. is considered a swing oil producer and its production is tightly related to market demand. Financers of oil companies are now weighing their options, “Is the oil shortage going to be a temporary one or not?” They have been burned before by previous rapid expansion that did not translate into the profits investors expected. Investors and oil company executives are unsure of what to do. Should the spigots be turned back on, or should we wait and see?

It may not be that simple though. Oil companies may not be able to help offset the loss of Russian supplies sufficiently. During COVID, many workers in the fracking field found other employment and may not be that enthusiastic about jumping back on a ship that may or not float. Loss of funding for infrastructure has left the industry with a severe lack of equipment, which would be needed to get production back to pre-COVID levels. According to Chris Wright, chief executive of Liberty Oilfield services, “We have shortages of labor, sand and equipment, and it will take 18 months to ramp up”. A lot of equipment has been retired; a lot of equipment is past its useful life.” (Eaton, 2022)

Oil companies, however, have not been sitting patiently with their hands folded waiting for a war to boost demand. They found an existing demand and are making huge investments in exploiting it. As the world increasingly turns toward renewable energy and strives to decarbonize, fossil fuel giants like Shell are trying to advance a new plastics boom to keep their ventures afloat. Lured to Pennsylvania by an “unlimited tax credit,” Shell oil has invested over six billion dollars to produce a huge ethane cracker plant in Beaver County, Pennsylvania and, if current profit predictions pan out, there will certainly be other plants that will follow. They will all require copious quantities of shale gas obtained through fracking. Hence, the Shell plant was built near the Marcellus shale fields of Pennsylvania (Marusic, 2022).

Ethane cracking is a process that takes ethane, a gas commonly found with oil and natural gas deposits, and it turns it into the building blocks of plastic. As part of the refining process, ethane is first separated from methane as the raw shale gas is refined. Methane continues along one route and ethane goes into producing plastic. In the cracking process, ethane is converted to ethylene and then into polyethylene. Polyethylene pellets are then transported to plastic producers.

When the ethane cracker plant was proposed, nearby residents were promised a 25-year operating contract, thousands of construction jobs, and over six hundred permanent workers hired upon completion. In addition, local businesses in the region could expect up to 20,000 direct and indirect new jobs.

At the outset, this would seem like a workable solution. There seems to be a never-ending need for plastics in our modern economy. According to a report from NPR, ever since China stopped accepting most of our waste plastic, only about 5% of the plastic currently produced is being recycled. Plastic from ethane cracking would help make up the difference by providing the raw material needed for new products.

Yet, there are concerns that this plastic will end up doubling the size of our landfills and residents worry about increases in air pollution from cracker plants. As always, will the benefits outweigh the costs?

Another industry that will see their services in high demand are environmental companies and consultants. From the increase in gas production from current wells, the fracking of new wells, and the associated pipelines and rights-of-way that will be built, there will be a tremendous increase in the need for wetland delineation services. Every one of these new projects will require delineation of the sites.

Hopefully, the war in Ukraine will soon be over but no one knows how countries will respond to their energy needs in the future. Will they return to their traditional fossil fuel trading partner, Russia, or will the US become Europe’s new go-to partner for oil and gas? As is usually the case, money will be the central focus. Where can we get the energy we need at the lowest price while minimizing political fallout?

As for plastics, we have become dependent on them, and production is expected to double by 2040 and increase by 2.5 times by 2050.

We are certainly in for some major changes. Which direction they take is still the subject of debate.

References:

1. Smith, K. (2022, February 24). Fracking Is a Powerful Weapon Against Russia. Bloomberg -The Washington Post.

2. Marusic, K. (2022, September 15). These are the New Titans of Plastic – Pennsylvania becomes the newest sacrifice zone for America’s plastic addiction. Sierra Magazine.

3. Eaton, C. (2022, March 9). Frackers Say Bottlenecks Impede Output Boost as Oil Prices Soar. The Wall Street Journal.

4. Frazier, R. (2017, April 7) This is exactly How Natural Gas Gets Turned into Plastics. Part of a series, “Energy – The coming Chemical Boom.” The Allegheny Front This story was originally published on September 9, 2016.
2022 EPA Construction General Permit (CGP)

On January 18, 2022, the US EPA signed its 2022 Construction General Permit (CGP) for stormwater discharges from construction activities. This new permit became effective February 17, 2022. It also replaces the 2017 CGP.

The nationwide effect of this permit is limited. The EPA does not have NPDES permitting authority in all states and territories. However, it is effective in the following locations:

  • Massachusetts, New Hampshire, New Mexico, and the District of Columbia
  • American Samoa, Guam, Johnston Atoll, Midway and Wake Islands, Northern Mariana Islands, and Puerto Rico
  • Tribal lands within Alabama, Alaska, Arizona, California, Colorado, Connecticut, Florida, Idaho, Iowa, Kansas, Louisiana, Massachusetts, Michigan, Minnesota, Mississippi, Montana, Nebraska, Nevada, New Mexico, New York, North Carolina, North Dakota, Oklahoma, Oregon, Rhode Island, South Dakota, Texas, Utah, Virginia, Washington, Wisconsin, and Wyoming
  • Federal facilities within Colorado, Delaware, and Vermont, and areas within Washington subject to construction by a federal operator
  • Denali National Park and Preserve
  • Oil and gas activities in Oklahoma

There are several significant changes from the 2017 CGP. These include:

  • Differentiation between routine maintenance and corrective action
  • Clarification on flexibilities for arid and semi-arid areas
  • Requirements for inspections during snowmelt conditions
  • Availability of key documents in electronic form
  • Endangered Species Act (ESA) eligibility determinations
  • Perimeter control requirements
  • Documenting signs of sedimentation
  • Notice of Intent (NOI) Updates
  • Mandatory Training Requirements

The mandatory training requirements go into effect on February 17, 2023. After this time, persons conducting inspections will have to have taken and passed the EPA Construction Inspection Course. Alternatively, if an inspector already has construction inspection certification or license, it may suffice to supply the certification or license program that covered the material outlined in the new permit. Some of this material is new and is unlikely to have been covered for a course that pre-dates the 2022 CGP. The EPA does allow you to supplement your training with their online training class. The good news is the EPA class is free.

There are a lot of updates to documentation that is needed, and mandatory timeframes that must be met. There are also several new provisions for sensitive waters and contaminated sites. The EPA training class covers all of this in about 6 hours. This is offered in five modules. The test at the end is 40 questions.

The EPA training is free, but you will need to keep track of your studies. The system does not bookmark your progress so if you are in the middle of a module and must stop, you cannot pick up from where you left off. However, you do have an unlimited number of test tries to get an 80% passing grade.

To learn more about the EPA training click the button below.

Problems Posed By PFAS

A recent study revealed that approximately 200 million pounds of toxic substances were released into U.S. waterways in 2020. Although per- and polyfluoroalkyl substances (PFAS) make up only 440 pounds of the total released toxics, the report emphasizes that only 172 out of 12,000 PFAS chemicals must be reported to the EPA’s Toxics Release Inventory (TRI). There is a strong likelihood that PFAS chemicals make up a higher concentration of the total released toxics in our waterways.

What are PFAS?

PFAS are a group of synthetic chemicals that are used in common products like non-stick cookware, water-resistant clothing, fire-fighting foam, and carpeting. These chemicals are often referred to as “forever chemicals” as they are nearly impossible to break down. This is due to their carbon-fluorine bond which is the strongest single bond. Chemicals like PFOA, PFOS, and GenX belong to the parent group of PFAS. The production of perfluorooctanoic acid (PFOA) and perfluoro octane sulfate (PFOS) began in the 1940’s with the invention of non-stick cookware. The production of PFOA and PFOS have since been banned once they were discovered to cause a variety of health issues in humans. Despite the ban of PFOA and PFOS, these chemicals are still persistent in the environment and GenX, along with other PFAS chemicals, are still produced and released into the environment today.

There has been a growing concern of the health and safety of PFAS released into the environment. Their persistence in the environment has resulted in concentrations found in drinking water sources across several municipalities in the United States. In a study conducted by the Environmental Working Group, they found that over 2,800 locations documented a PFAS contamination- they further estimate that over 200 million Americans could have PFAS in their drinking water. These substances are incredibly dangerous as they have been linked to illnesses like liver and kidney cancer, fertility problems, immunosuppression, and diabetes.

PFAS in the Environment

As research into PFAS is new, there are a lot of unknowns about their effect on ecological functions. It has been proven that PFAS can bioaccumulate in fish and wildlife as they do in humans. In laboratory settings, animals exposed to PFAS experienced damage to their livers and immune systems, as well as developmental issues in juvenile stages. It can be assumed that wildlife exposed to considerable amounts of PFAS would experience increased mortality rates overtime.

Bioremediation Strategies

As we know, wetland ecosystems function as filters for the environment by trapping sediment and filtering pollutants from surface waters. There are a few emerging reports that have shown the bioremediation of PFAS using microorganisms and vegetation found in wetlands.

Microorganisms:

As mentioned earlier, PFAS are a persistent contaminant due to their carbon-fluorine bond. Researchers Shan Huang and Peter JaffĂ© discovered the bacterium Acidimicrobiaceae sp. A6, which is found in New Jersey wetland soils, can break this bond through a reaction called Feammox. Over a course 100 days, the microbe had degraded 60% of the PFOA culture and 50% of the PFOS culture. The applicability of this microbe in wetlands could supply an efficient method to control contaminated soils and groundwater.

Vegetation:

Wetland plants show some of the most unique adaptations to survive in an oxygen deficient environment. A few reports have shown how Juncus sarophorus (Broom Rush), Phragmites australis (Common Reed) and Willows (Genus Salix) can control PFAS contamination through phytoremediation. This environmental engineering tactic is often used for removing metals, sewage, and common wastes from the environment. It is worth noting that most of these experiments were conducted in hydroponic systems. The intention of these studies was to analyze the use of these plants in constructed or floating wetland systems for areas with low levels of PFAS. As more research develops on this subject, it would be interesting to see the comparison of phytoremediation rates between floating/constructed wetlands and natural wetlands.

Sources:

Awad, J., Brunetti, G., Juhasz, A., Williams, M., Navarro, D., Drigo, B., Bougoure, J., Vanderzalm, J., & Beecham, S. (2022). Application of native plants in constructed floating wetlands as a passive remediation approach for PFAS-impacted surface water. Journal of Hazardous Materials, 429. Retrieved from https://doi.org/10.1016/j.jhazmat.2022.128326

HMVT Environmental Solutions. (n.d.). Treatment of PFAS in a constructed wetland using willows. HMVT Environmental Solutions. Retrieved from https://www.hmvt.nl/en/news/treatment-of-pfas-in-a-constructed-wetland-using-willows/

Huang, S. & Jaffé, P. (2019). Defluorination of Perfluorooctanoic Acid (PFOA) and Perfluorooctane Sulfonate (PFOS) by Acidimicrobium sp. Strain A6. Environmental Science & Technology, 53, 11410-11419. Retrieved from http://pubs.acs.org/doi/abs/10.1021/acs.est.9b04047

Rumpler, J., Casale, M., Dutzik, T., & Huxley-Reicher, B. (2022). Wasting our waterways: Toxic pollution and the unfulfilled promise of the Clean Water Act. Environment America Research and Policy Center. Retrieved from https://environmentamerica.org/center/resources/wasting-our-waterways/

Zhu, J., Wallis, I., Guan, H., Ross, K., Whiley, H., & Fallowfield, H. (2022). Juncus sarophorus, a native Australian species, tolerates and accumulates PFOS, PFOA and PFHxS in a glasshouse experiment. Science of The Total Environment, 826. Retrieved from https://doi.org/10.1016/j.scitotenv.2022.154184