Biological Control of Purple Loosestrife

John D. Byrd, Mississippi State University, Bugwood.org

Introduced species that cause economic or environmental harm, or harm to human health, are called invasive species. The National Invasive Species Information Center states that “…these plants are characteristically adaptable to new habitats, grow aggressively, and have a high reproductive capacity. Invasive plants are often introduced to a new location without environmental checks and balances, such as seasonal weather, diseases, or insect pests that kept them under control in their native range. Their vigor, combined with a lack of natural enemies, often leads to outbreak populations.”

Invasive Wetland Plants

When one thinks of invasive wetland plant species, these four species probably come to mind, Reed Canary Grass (Phalaris arundinacea), Purple Loosestrife (Lythrum salicaria), Common Reed (Phragmites spp.), and Cattails (Typha spp.). Reed Canary Grass was introduced by settlers and farmers who planted this grass as a food source for their livestock. Boats from Eurasia inadvertently carried Phragmites seeds in their ballast. Purple Loosestrife was either accidentally introduced via ship ballasts or deliberately brought over as an ornamental.

Wetlands provide benefits ranging from water filtration to storm surge protection; however, wetlands have become vulnerable to invasive species. Wetlands seem to be especially vulnerable to invasions. Even though ≤6% of the earth’s land mass is wetland, 24% (8 of 33) of the world’s most invasive plants are wetland species. Furthermore, many wetland invaders form monotypes, which alter habitat structure, lower biodiversity (both the number and “quality” of species), change nutrient cycling and productivity (often increasing it), and modify food webs. Wetlands are landscape sinks, which accumulate debris, sediments, water, and nutrients, all of which facilitate invasions by creating canopy gaps or accelerating the growth of opportunistic plant species (Zedler & Kercher, 2004).

Purple Loosestrife

Purple loosestrife, a native to Eurasia, was introduced to eastern North America in the early to mid-1800s. It has the ability to become the dominant plant species in many wetlands. One plant can produce as many as 2 million wind-dispersed seeds per year, and underground stems grow at a rate of 1 foot per year.

Control of invasive wetland plants generally falls into one of three categories: mechanical, chemical, and biological. Mechanical control means physically removing plants from the environment through cutting or pulling. Chemical control uses herbicides to kill plants and inhibit regrowth. Biological controls use plant diseases or insect predators, typically from the targeted species’ home range. 

Biological Control

Biological controls are moving into the forefront of control methodologies, but the only widely available and applied biocontrol relates to Purple Loosestrife. Three different species have been used in North America to attempt to control purple loosestrife: two species of beetles and one weevil.

Galerucella pusilla and G. calmariensis are leaf-eating beetles that seriously affect growth and seed production by feeding on the leaves and new shoot growth of purple loosestrife plants. The two species share similar ecology and life history. Adults feed on young plant tissue, causing a characteristic “shot hole” defoliation pattern. The larva feed on the foliage and strip the photosynthetic tissue off individual leaves, creating a “windowpane” effect. At high densities (greater than 2-3 larvae per centimeter of the shoot), entire purple loosestrife populations can be defoliated. Several defoliations are needed to kill the plant. Adult beetles are mobile and possess good host-finding abilities. 

According to wetland scientist, Tom Ward, species of Galerucella beetles have been released in Upstate New York in prior years as a biological control for Purple Loosestrife.

“Every year, I find new beetles in new areas. While the loosestrife is not completely eliminated, it is controlled, as individual plants become stressed to the point where they do not flower. The beetles have had good success at controlling the loosestrife. In my experience, I would estimate that it is between 70-75% effective. The beetles, once released, naturally reproduce on their own and then disperse as the food source gets depleted. Therefore, loosestrife control is cyclic. Once the beetles deplete the food source, they move to other nearby food sources. That allows the loosestrife to regenerate, but not at levels experienced before release. As the loosestrife returns to a specific site, so do the beetles.” 

Tom Ward, CWB, PWS

Future Use

Recent scientific advancements in genetics and interactions between host plants and their micro-organisms create a unique opportunity to develop cutting-edge technologies to control invasive and promote native species establishment, further improving the efficiency and results of management actions. Sequencing and describing a plant’s genome opens the door to species-specific treatments that limit the expression of specific traits that help non-native plants outcompete native plants and invade critical habitats. By testing new non-toxic bioherbicides that target the relationship between invasive plants and bacteria, fungi, and other microbes, we can advance our understanding of how microbes contribute to plant invasiveness. However, these lines of research are novel and still full of many unknowns. 

Sources

Chandler, M. and Skinner, L.C. (n.d.). Biological Control of Invasive Plants in Minnesota. Minnesota Departments of Agriculture and Natural Resources. Retrieved from https://files.dnr.state.mn.us/natural_resources/invasives/biocontrolofplants.pdf

Minnesota Department of Natural Resources. (n.d.). Purple Loosestrife control: Biological; Purple loosestrife Biological Control: A success story. Retrieved from dnr.state.mn.us/invasives/aquaticplants/purpleloosestrife/biocontrol.html

Zedler, J.B. and Kercher, S. (2004) Causes and Consequences of Invasive Plants in Wetlands: Opportunities, Opportunists, and Outcomes. Critical Reviews in Plant Sciences, 23, 431-452. http://dx.doi.org/10.1080/07352680490514673

2023 Waters of the United States

This week, the new Waters of the U.S. (WOTUS) rule was enacted. On December 30, 2022, the agencies announced the final “revised definition of ‘waters of the United States” rule. The rule was published in the Federal Register on January 18, 2023, and became effective on March 20, 2023.

The agencies developed this rule with consideration to the relevant provisions of the Clean Water Act and the statute as a whole, relevant Supreme Court case law, and the agencies’ technical expertise after more than 45 years of implementing the longstanding pre-2015 “waters of the United States” framework. This rule also considers the best available science and extensive public comment to establish a definition of “waters of the United States” that supports public health, environmental protection, agricultural activity, and economic growth.

There are numerous lawsuits and challenges to this rule. These come from both sides of the aisle and include several lobbying groups, environmental organizations, states, and tribes. In addition, we are still waiting to hear from the U.S. Supreme Court on the now-infamous Sackett case. This case directly challenges the new WOTUS rule.
The following is the new WOTUS rule. There are several pages associated with the rule, but this is the meat of it.

Part 328 Definition of Waters of the United States- Regulatory Text

  1. The authority citation for part 328 continues to read as follows:
    • Authority: 33 U.S.C. 1251 et seq.

Definitions

  1. Revise § 328.3 to read as follows:
    • For the purpose of this regulation these terms are defined as follows:
      • a) Waters of the United States means:
        • 1) Waters which are:
          • (i) Currently used, or were used in the past, or may be susceptible to use in interstate or foreign commerce, including all waters which are subject to the ebb and flow of the tide;
          • (ii) The territorial seas; or
          • (iii) Interstate waters, including interstate wetlands;
        • (2) Impoundments of waters otherwise defined as waters of the United States under this definition, other than impoundments of waters identified under paragraph (a)(5) of this section;
        • (3) Tributaries of waters identified in paragraph (a)(1) or (2) of this section:
          • (i) That are relatively permanent, standing or continuously flowing bodies of water; or
          • (ii) That either alone or in combination with similarly situated waters in the region, significantly affect the chemical, physical, or biological integrity of waters identified in paragraph (a)(1) of this section;
        • (4) Wetlands adjacent to the following waters:
          • (i) Waters identified in paragraph (a)(1) of this section; or
          • (ii) Relatively permanent, standing or continuously flowing bodies of water identified in paragraph (a)(2) or (a)(3)(i) of this section and with a continuous surface connection to those waters; or
          • (iii) Waters identified in paragraph (a)(2) or (3) of this section when the wetlands either alone or in combination with similarly situated waters in the region, significantly affect the chemical, physical, or biological integrity of waters identified in paragraph (a)(1) of this section;
        • (5) Intrastate lakes and ponds, streams, or wetlands not identified in paragraphs (a)(1) through (4) of this section:
          • (i) That are relatively permanent, standing or continuously flowing bodies of water with a continuous surface connection to the waters identified in paragraph (a)(1) or (a)(3)(i) of this section; or
          • (ii) That either alone or in combination with similarly situated waters in the region, significantly affect the chemical, physical, or biological integrity of waters identified in paragraph (a)(1) of this section.
    • (b) The following are not “waters of the United States” even where they otherwise meet the terms of paragraphs (a)(2) through (5) of this section:
      • (1) Waste treatment systems, including treatment ponds or lagoons, designed to meet the requirements of the Clean Water Act;
      • (2) Prior converted cropland designated by the Secretary of Agriculture. The exclusion would cease upon a change of use, which means that the area is no longer available for the production of agricultural commodities. Notwithstanding the determination of an area’s status as prior converted cropland by any other Federal agency, for the purposes of the Clean Water Act, the final authority regarding Clean Water Act jurisdiction remains with EPA;
      • (3) Ditches (including roadside ditches) excavated wholly in and draining only dry land and that do not carry a relatively permanent flow of water;
      • (4) Artificially irrigated areas that would revert to dry land if the irrigation ceased;
      • (5) Artificial lakes or ponds created by excavating or diking dry land to collect and retain water and which are used exclusively for such purposes as stock watering, irrigation, settling basins, or rice growing;
      • (6) Artificial reflecting or swimming pools or other small ornamental bodies of water created by excavating or diking dry land to retain water for primarily aesthetic reasons;
      • (7) Waterfilled depressions created in dry land incidental to construction activity and pits excavated in dry land for the purpose of obtaining fill, sand, or gravel unless and until the construction or excavation operation is abandoned and the resulting body of water meets the definition of waters of the United States; and
      • (8) Swales and erosional features ( e.g., gullies, small washes) characterized by low volume, infrequent, or short duration flow.
    • (c) In this section, the following definitions apply:
      • (1) Wetlands means those areas that are inundated or saturated by surface or ground water at a frequency and duration sufficient to support, and that under normal circumstances do support, a prevalence of vegetation typically adapted for life in saturated soil conditions. Wetlands generally include swamps, marshes, bogs, and similar areas.
      • (2) Adjacent means bordering, contiguous, or neighboring. Wetlands separated from other waters of the United States by man-made dikes or barriers, natural river berms, beach dunes, and the like are “adjacent wetlands.”
      • (3) High tide line means the line of intersection of the land with the water’s surface at the maximum height reached by a rising tide. The high tide line may be determined, in the absence of actual data, by a line of oil or scum along shore objects, a more or less continuous deposit of fine shell or debris on the foreshore or berm, other physical markings or characteristics, vegetation lines, tidal gages, or other suitable means that delineate the general height reached by a rising tide. The line encompasses spring high tides and other high tides that occur with periodic frequency but does not include storm surges in which there is a departure from the normal or predicted reach of the tide due to the piling up of water against a coast by strong winds such as those accompanying a hurricane or other intense storm.
      • (4) Ordinary high water mark means that line on the shore established by the fluctuations of water and indicated by physical characteristics such as clear, natural line impressed on the bank, shelving, changes in the character of soil, destruction of terrestrial vegetation, the presence of litter and debris, or other appropriate means that consider the characteristics of the surrounding areas.
      • (5) Tidal waters means those waters that rise and fall in a predictable and measurable rhythm or cycle due to the gravitational pulls of the moon and sun. Tidal waters end where the rise and fall of the water surface can no longer be practically measured in a predictable rhythm due to masking by hydrologic, wind, or other effects.
      • (6) Significantly affect means a material influence on the chemical, physical, or biological integrity of waters identified in paragraph (a)(1) of this section. To determine whether waters, either alone or in combination with similarly situated waters in the region, have a material influence on the chemical, physical, or biological integrity of waters identified in paragraph (a)(1) of this section, the functions identified in paragraph (c)(6)(i) of this section will be assessed and the factors identified in paragraph (c)(6)(ii) of this section will be considered:
        • (i) Functions to be assessed:
          • (A) Contribution of flow;
          • (B) Trapping, transformation, filtering, and transport of materials (including nutrients, sediment, and other pollutants);
          • (C) Retention and attenuation of floodwaters and runoff;
          • (D) Modulation of temperature in waters identified in paragraph (a)(1) of this section; or
          • (E) Provision of habitat and food resources for aquatic species located in waters identified in paragraph (a)(1) of this section;
        • (ii) Factors to be considered:
          • (A) The distance from a water identified in paragraph (a)(1) of this section;
          • (B) Hydrologic factors, such as the frequency, duration, magnitude, timing, and rate of hydrologic connections, including shallow subsurface flow;
          • (C) The size, density, or number of waters that have been determined to be similarly situated;
          • (D) Landscape position and geomorphology; and
          • (E) Climatological variables such as temperature, rainfall, and snowpack.

New Data Sheet for Identifying Ordinary High Watermarks

Press Release:

For 10 years, the U.S. Army Engineer Research and Development Center’s (ERDC) Cold Regions Research and Engineering Laboratory (CRREL) has  led research on the development of a national manual and data sheet to identify the Ordinary High Water Mark (OHWM) across the United States.

The national manual was released as an interim draft and describes the OHWM, which is used to define the boundaries of aquatic features for a variety of federal, state and local regulatory purposes.

Dr. Gabrielle David, a CRREL research physical scientist, began working on the manual at its inception, and is the chair of the National Technical Committee for OHWM, a group formed with representatives from the Environmental Protection Agency (EPA), regulators from the U.S. Army Corps of Engineers (USACE) and academia. Recently, members of the committee took the manual’s data sheet into the field, going to several rivers and streams in Vermont to take another critical look at their work prior to releasing the manual.

“This is the first time that we’re publishing something nationally to help improve consistency throughout the nation,” said David. “We’ve built a data sheet because we want to help regulators be more rapid in their decision making, be consistent, and have technical defensibility nationwide.”

David also said that even though the OHWM concept has been in regulation for awhile, there has never been a national technical manual published.

Data Sheet and Manual

“We’re releasing it for a one-year period and asking for public comments so that we can then incorporate that into the final version,” said David. “We want to make sure that we have a data sheet and manual that is as helpful as it can be for regulators and for the public.”

Dr. Tracie Nadeau, an EPA environmental scientist, was also in the field with David and USACE regulators using the data sheet to identify OHWM features. Nadeau said the data sheet and manual will be a major asset to the EPA as they work to enforce the Clean Water Act.

“The data sheet is critical for a lot of reasons,” said Nadeau. “When our folks get out in the field and have to make these decisions about how we’re regulating the waters that are under the protection of the Clean Water Act, the data sheets and user manual help assure that we get really consistent decisions in the field across the country.”

The Clean Water Act establishes the basic structure for regulating discharges of pollutants into the waters of the United States and regulating quality standards for surface waters. The basis of the Clean Water Act was enacted in 1948 and was called the Federal Water Pollution Control Act, but it was significantly reorganized and expanded in 1972. “Clean Water Act” became the Act’s common name with amendments in 1972.

Under the Clean Water Act, the EPA has implemented pollution control programs, such as setting wastewater standards for industry. The EPA has also developed national water quality criteria recommendations for pollutants in surface waters. Section 404 of the CWA establishes a permitting program implemented by USACE, which regulates the discharge of dredged and fill material into the water of the United States.

Applicability

Nadeau said the national manual and data sheet are important for good government, for consistency, and for the defensibility of the decisions that the EPA or USACE makes. She added that the data sheets are a quick “how-to roadmap” of applying the information from the manual.

“So, for us at EPA, we co-administer the Clean Water Act with the Army Corps of Engineers,” said Nadeau. “But EPA actually has to administer all these other programs under the Clean Water Act in its entirety. So, for EPA in particular, we will definitely use these data sheets in the larger manual of how we go out and do a determination of ordinary high-water mark to support lots of programs under the Clean Water Act, because we have to know where the federal government actually has authorities or jurisdiction, so it’s really helpful for the decisions we make around permitting, around national pollution discharge.”

ERDC works with the USACE Regulatory Program, other federal agencies and the academic community to develop regional and national OHWM delineation standards and procedures, as well as to improve OHWM delineation practices across the country. Research scientists test and validate the field indicators and methods used in OHWM delineations and explore new tools, techniques and resources to improve the accuracy, consistency and efficiency of OHWM delineation practices. These efforts have resulted in OHWM delineation manuals, such as the newly released national manual and data sheet, and other technical resources that support both the Corps Regulatory Program and the regulated public.

Sources

Marquis, D. (2023). Press release: ERDC Releases New Data Sheet for Identifying Ordinary High Watermarks. Cold Regions Research Laboratory. Retrieved from https://www.erdc.usace.army.mil/Media/News-Stories/Article/3280392/erdc-releases-new-data-sheet-for-identifying-ordinary-high-watermarks/

Swamp School Patreon

In addition to our weekly newsletter, we are publishing podcasts on the newsletter topic for our Patreon subscribers. This week, we’ll be discussing ditches and their regulatory implications.

Become a Patron today for early access!

Draft National Wetland Plant List Now Published

U.S. Army Corps of Engineers Regional Supplements

The draft version of the 2022 National Wetland Plant List (NWPL) has been published in the Federal Register and is available for public comment. The update to the list has been long-awaited, as the previous 2020 NWPL was last published in November 2021.

Proposed Updates

There are not many changes in the draft 2022 NWPL. The U.S. Army Corps has changed the indicator status of two plant species in the Arid West Regional Supplement. Coastal Goldenbush (Isocoma menziesii) has changed from Facultative (FAC) to Facultative Upland (FACU), and Fremont Cottonwood (Populus fremontii) has changed from FAC to Facultative Wetland (FACW).

The Army Corps has also proposed changing the frequency of when NWPLs will be updated. They proposed releasing lists every three years instead of every two years. For example, the following plant list will publish in 2025. This change stems from the gradual decrease in public comments over the years. Presumably, this update would also resolve the delay in NWPL publications caused by the COVID-19 pandemic.

Summary

The National Wetland Plant List (NWPL) provides plant species indicator status ratings, which are used in determining whether the hydrophytic vegetation factor is met when conducting wetland delineations under the Clean Water Act and wetland determinations under the Wetland Conservation Provisions of the Food Security Act. Other applications of the NWPL include wetland restoration, establishment, and enhancement projects. To update the NWPL, the U.S. Army Corps of Engineers (USACE), as part of an interagency effort with the U.S. Environmental Protection Agency (EPA), the U.S. Fish and Wildlife Service (FWS), and the U.S. Department of Agriculture Natural Resources Conservation Service (NRCS), is announcing the availability of the proposed changes to the 2022 NWPL and its web address to solicit public comments.

The public will now have the opportunity to comment on the proposed changes to wetland indicator status ratings for two plant species in the Arid West (AW) region. In addition, we are accepting comments on the proposal to move from a two-year update cycle to a three-year update cycle for the NWPL. Finally, USACE is seeking comments on the overall NWPL update process.

U.S. Army Corps of Engineers. (2023). National Wetland Plant List. Federal Register. https://www.federalregister.gov/d/2023-01026

Comments

Comments on the 2022 NWPL can be submitted until March 21, 2023. The NWPL draft is linked here: 2022 NWPL Draft.

Comments can be mailed to: U.S. Army Corps of Engineers, Attn: CECW-CO-R, 441 G Street NW, Washington, DC 20314-1000.

For additional information, the Army Corps has designated Brianne McGuffie as the point of contact for the NWPL. She can be reached by phone at 202-761-4750 or by email at brianne.e.mcguffie@usace.army.mil.

Waterbirds Protected from Lead Ammunition

On February 15, the European Union (EU) banned lead-shot ammunition in wetlands across all thirty European and Scandinavian countries. There will be a 2-year grace period to prepare for the ban accordingly. The ban will protect waterbirds from ingesting lead pellets from ammunition rounds. Anyone within 100 meters (328 ft.) of any wetland must use non-toxic ammunition. Anyone carrying a lead shot within 100 meters of a wetland will be presumed guilty of wetland shooting; unless proven otherwise.

New Regulation

This regulation has been in the works since 2015 when the EU Commission asked the European Chemicals Agency to submit a report on how a lead ammunition restriction would reduce lead found in wetlands for waterbird hunting. This ban is consistent with the EU’s Registration, Evaluation, Authorization, and Restriction of Chemicals (REACH) regulation and the African-Eurasian Migratory Waterbirds Agreement (AEWA) push towards restricting lead ammunition in wetlands.

Waterbirds & Lead Poisoning

Lead is highly toxic to humans and animals when ingested in chronic amounts. Waterbirds are susceptible to lead poisoning because they mistake lead pellets for food or gravel, which they need to digest food. Once lead enters the bird’s gizzard (loons, ducks, geese, and swans) or ventriculus (eagles), it dissolves and absorbs into the bodily tissue. Treatment for lead poisoning in waterbirds is possible if caught early enough. However, most cases of lead poisoning go unnoticed and untreated. Over one million waterbirds die of lead poisoning in the EU each year.

Lead accumulation in waterbird populations presents another concern for waterbirds and humans. Accumulation can cause impacts on physiology, population growth, and reproductive rates in waterbird populations with direct exposure to lead. The exposure pathway can continue through raptors or scavenger species that prey upon waterfowl exposed to lead. Exposure can even reach humans if they forage with lead ammunition.

What about the U.S.?

Similar regulations have been passed in the United States to protect waterfowl and wetlands. In 1991, the U.S. Code of Federal Regulations (CFR) issued a nationwide ban on lead-based ammunition for waterfowl hunting. The regulation permits alternative ammunitions, including ammunitions made of bismuth, steel, and tungsten alloys. This past fall, the U.S. Fish and Wildlife Service issued their 2022-2023 hunting season rule. In this rule, they stated that their National Wildlife Refuges will prohibit or propose a ban on lead ammunition by 2026. A handful of their Refuges have already banned lead ammunition.

Since the U.S. ban in 1991, the number of deaths from lead poisoning in waterfowl has significantly decreased. Some states have expanded on this ban to restrict the use of lead tackle gear. Europe’s new lead shot ban is a tremendous stride toward wetland and waterfowl protection. They hope that once this ban is set in place after the grace period, over one million waterbirds will be spared from lead poisoning in the European Union.

Sources

Bird Life International. (2023). Press release: Lead ammunition finally banned from wetlands across the EU. Retrieved from https://www.birdlife.org/news/2023/02/14/press-release-lead-ammunition-finally-banned-from-wetlands-across-the-eu/

Chudzik, M. (2022). USFWS issues new lead ammunition rules on wildlife refuges. The Wildlife Society. Retrieved from https://wildlife.org/usfws-to-enforce-new-lead-ammunition-rules-on-wildlife-refuges/

Federation of Associations for Hunting and Conservation of the EU. (2022). New regulation proibiting lead shot over wetlands takes effect from 15 February 2023. Retrieved from https://www.face.eu/2022/11/new-regulation-prohibiting-lead-shot-over-wetlands-takes-effect-from-15-february-2023/

Michigan Department of Natural Resources. (n.d.). Lead Poisoning. Retrieved from https://www.michigan.gov/dnr/managing-resources/wildlife/wildlife-disease/lead-poisoning

Pain, D. J., Mateo, R., & Green, R. E. (2019). Effects of lead from ammunition on birds and other wildlife: A review and update. Ambio, 48, 935–953. Retrieved from https://link.springer.com/article/10.1007/s13280-019-01159-0#citeas

Wildfowl and Wetlands Trust. (n.d.). Tackling lead ammunition poisoning. Retrieved from https://www.wwt.org.uk/our-work/projects/tackling-lead-ammunition-poisoning/

Wildlife Futures Team. (2021). Lead Poisoning. University of Pennsylvania. Retrieved from https://www.vet.upenn.edu/research/centers-laboratories/research-initiatives/wildlife-futures-program/resources/fact-sheets/fact-sheet-detail/lead-poisoning#:~:text=Waterfowl%20suffering%20from%20lead%20poisoning,walk%2C%20coma%2C%20and%20death.

Impacts of Ohio Environmental Trainwreck

On February 3rd, a freight train containing hazardous materials derailed near East Palestine, Ohio. Eleven of the thirty-eight derailed cars carried vinyl chloride, butyl acrylate, ethylene glycol monobutyl ether, ethylhexyl acrylate, and isobutylene. These substances are considered toxic to both humans and the environment. Early investigation shows the train derailed due to a faulty wheel bearing on one of the cars.

Contamination

In the days following the derailment, residents of East Palestine evacuated while remediation crews moved in to control the hazardous materials. Remediation teams conducted a controlled explosion in an effort to remove the substances. The explosion burned the remaining vinyl chloride, which caused a large black plume of smoke to engulf East Palestine.

The substances of particular concern were vinyl chloride and butyl acrylate. Vinyl chloride is a colorless gas used to produce PVC and hard plastics. Butyl acetate is a clear liquid used in paint, adhesives, and caulk. Inhalation of these chemicals can cause headaches, dizziness, shortness of breath, and nausea. Liver damage and cancer have been linked to chronic exposure to vinyl chloride. In the last few weeks, residents in East Palestine have reported various ailments, including shortness of breath, headaches, and skin rashes.

In a statement released by the railway company Norfolk Southern, over 15,000 pounds of soil and 1.1 million gallons of contaminated water have been removed from the crash site. The evacuation was lifted on February 8th after the state of Ohio’s Environmental Protection Agency and the EPA determined the local air quality and drinking water was safe for residents. Many residents have expressed concern about the conditions despite the results of the environmental quality tests.

Surrounding Waterways and Wetlands

Mississippi River Systems

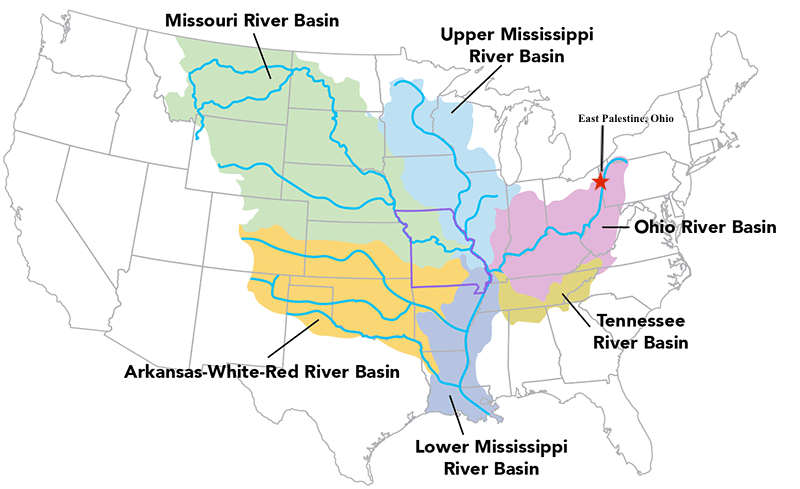
A predominant concern for most residents and Americans has been the proximity of the train derailment to the Ohio River. The Ohio River is one of five major rivers that flows into the Mississippi River. A hazardous release of significant magnitude would not only affect the surrounding environment but would have severe implications for the environment and people living downstream. 

Sulphur Run is a local stream that flows into the Ohio River and crosses into the derailment site. In an effort to prevent further contamination downstream, officials rerouted and dammed a portion of Sulphur Run upstream of the derailment site. Sulphur Run was determined to have significant contamination downstream of the derailment and was lined with a series of aeration and carbon pumps to filter the contaminants from the stream. The Ohio EPA has stated that downstream waterways have low levels of contaminants but do not present concern at this time.

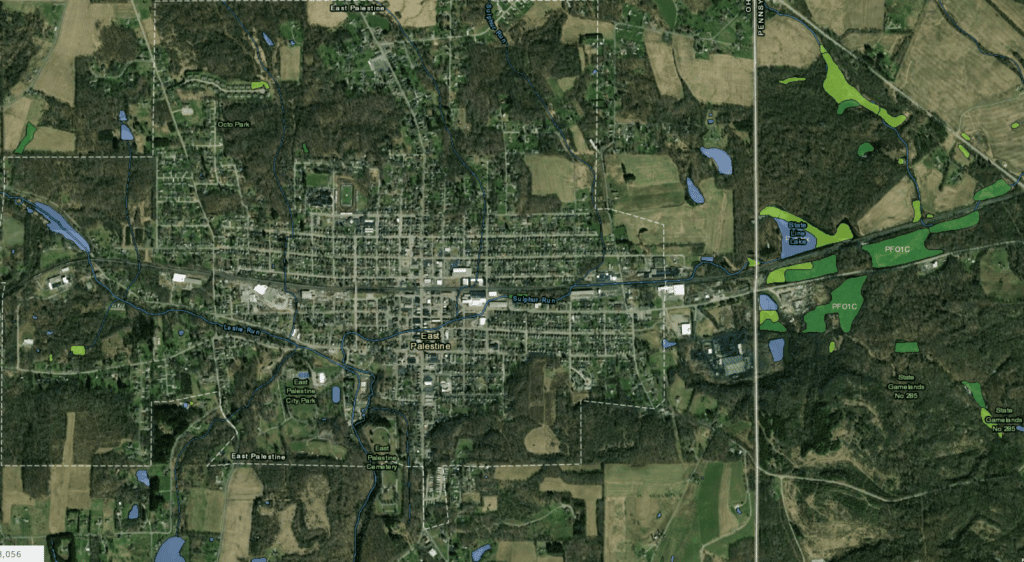
It is currently unclear how this release has impacted nearby wetlands. In the NWI map below, several forested and freshwater wetlands surround East Palestine. We will hopefully know the extent of the contamination in neighboring wetlands as more environmental assessments are completed.

Mapped NWI wetlands surrounding East Palestine, Ohio

Sources

Cohen, L. (2023). Ohio train derailment contaminated at least 15,000 pounds of soil and 1.1 million gallons of water, Norfolk Southern says. CBS News. Retrieved from https://www.cbsnews.com/news/ohio-train-derailment-contaminated-soil-water-norfolk-southern-says-east-palestine/

Phillips, A. (2023). Aerial Video of Ohio River Shows Color Change After Chemical Spill. Newsweek. Retrieved from https://www.newsweek.com/video-ohio-river-color-change-toxic-spill-east-palestine-train-derailment-1782395

Salahieh, N., Yan, H., & Colbert, C. (2023). As reports of health problems near a toxic train wreck pile up, Ohio sets up a clinic while federal help gets into gear. CNN. Retrieved from https://www.cnn.com/2023/02/20/us/ohio-train-derailment-east-palestine-monday/index.html

Sullivan, B. (2023). What to know about the train derailment in East Palestine, Ohio. NPR. Retrieved from https://www.npr.org/2023/02/16/1157333630/east-palestine-ohio-train-derailment

Why Do We Need Habitat Conservation Plans?

Imagine you own a restaurant that was not performing well. To increase your revenue, you decide to build a second restaurant. After weeks of searching, you finally find the perfect spot. However, you soon find out that your new plot of land is a habitat for an endangered bat. You realize that if you build on this land, you could be breaking federal laws. So, what can you do? Habitat Conservation Plans are useful tools to help you mitigate the effects to an endangered species.

Endangered Species Act

Let’s take a trip back to the 1970s. The Endangered Species Act (ESA) was passed in 1973 to protect endangered and threatened animals and plants. The Act protects species and their habitats, along with the illegal removal and trade of wildlife. Here is where the idea of a “take” comes in. Take is defined by the ESA as “to harass, harm, pursue, hunt, shoot, wound, kill, trap, capture, or collect, or to attempt to engage in any such conduct.” An example of take would include habitat modification that results in injury, death or impairing a species.

An “incidental take” is a permit that is required if a company’s business activities could potentially encounter any listed plant or animal wildlife species. For example, if you had to cut down the endangered bats tree for your construction project, that would be considered an incidental take. Other examples of activities would include building over a habitat, removing a critical food source, and tearing down breeding grounds. These permits can apply to species that are listed as endangered and those that are non-listed as well.

Habitat Conservation Plans

The US Fish & Wildlife Service developed Habitat Conservation Plans (HCP) in 1982 to enforce the Endangered Species Act. HCPs are required to obtain an incidental take permit. HCPs determine the potential effects of the proposed actions on endangered species and create mitigation plans for the species in question. HCPs can be complex documents. An HCP consists of six major sections, which include:

  • Introduction and Background
  •  Project Description and Activities Covered by Permit
  •  Environmental Setting and Biological Resources
  •  Potential Biological Impacts and Take Assessments
  •  Conservation Programs
  •  Plan Implementation

Plans in Action

In 2006, Copper Mountain College in California decided to expand to meet the demands of the growing population of San Bernardino. The college was planning to expand its campus into an area where the threatened desert tortoise lives. This expansion would have resulted in a “take” as described in the Endangered Species Act. The college applied for a habitat conservation plan to mitigate the effects on the tortoise and to avoid take. For mitigation, the college designated an 85-acre plot to re-home the tortoise.

The plot now serves as a permanent tortoise preserve. In addition, the college monitors the preserve to ensure there are no threats from predators or human activity. The college also minimizes human activities by providing a Tortoise Awareness Program for residents in the area. As a result of their work, Copper Mountain College was recognized as an environmental steward for the Mojave Desert ecosystem. The Endangered Species Act was passed for organizations to act in the same manner as Copper Mountain College.

Habitat conservation plans are required for proposed projects that could infringe on a listed species’ habitat and possibly threaten that species. These plans take time and effort to complete, but the intention is to protect wildlife. If you plan to conduct a project that affects wildlife, remember to understand the regulations required for habitat conservation plans.

Sources

Copper Mountain College. (2018). Tortoise Awareness. Retrieved from https://www.cmccd.edu/wp-content/uploads/2018/01/CMC-Tortoise-Awareness-Training-2018a.pdf

U.S. Fish and Wildlife Service (n.d.). Habitat Conservation Plans. Retrieved from https://www.fws.gov/service/habitat-conservation-plans

Researchers Develop New Wetland Mapping Tool

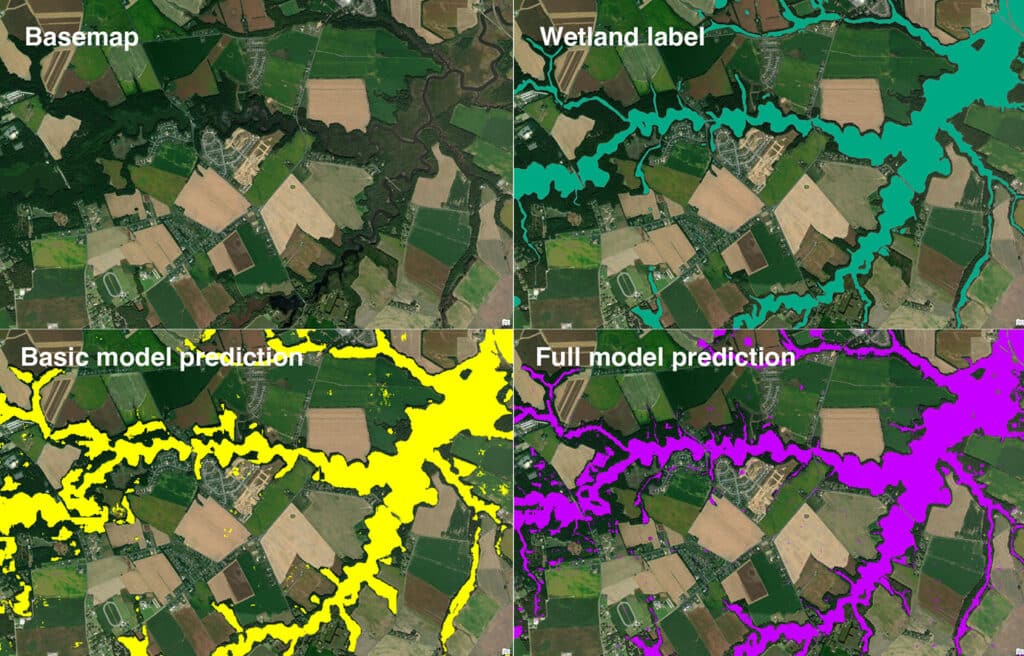
(Mainali et al., 2023)

The use of remote sensing and geographic information systems (GIS) has become a crucial tool for land-use planning and conservation efforts. Wetlands prove to be one of the more difficult landscapes to map due to the limited availability of aerial imagery and their unique features. Wetlands do not share the same vegetative cover, hydroperiod, and topography across the board. These wetland features can interfere with the resolution of a remote sensor. This forces spatial analysts to develop workarounds for wetland mapping techniques.

New Mapping Tool

Researchers at the Chesapeake Conservancy have developed a new mapping tool that uses an artificial intelligence and machine learning algorithm to map wetlands. They tested the preliminary mapping tool at three different sites in Delaware, Minnesota, and New York.  After comparing the sites, they determined that the tool effectively mapped the wetlands in the surrounding area with ~94% accuracy at 1m2 resolution.

Deep Learning Technology

Deep learning technology has become widely popular, especially with the advancement of smart devices. Tools and features that utilize deep learning algorithms include facial recognition, virtual assistants, and autonomous vehicles. This type of technology is also known for its enhancement of imagery, which is where the technology comes into play with remote sensing applications.

The research group at Chesapeake Conservancy trained a deep learning model known as a convolutional neural network (CNN). CNNs are commonly used to segment multispectral imagery. The neural network was programmed to obtain imagery from freely available sources like the Sentinel-2 satellite and the National Agricultural Imagery Program (NAIP).

As discussed earlier, wetland vegetation can hinder a remote sensor’s ability to accurately map wetlands. Forested wetlands are one of the hardest wetland ecosystems to map as the tree canopy obscures any visible water from airborne sensors. To combat this, the researchers at Chesapeake Conservancy incorporated the use of light detection and ranging (LiDAR) data in the mapping model to fill in any data gaps from aerial images. LiDAR is a remote sensing method that uses laser beams to create a three dimensional display of the Earth’s surface and features. Once LiDAR data was incorporated into the model, the tool improved it’s mapping accuracy by 2%.

The research team used the NWI as reference data for their mapping tool, but quickly found discrepancies with what had been mapped on the NWI versus the current conditions in the field. With these discrepancies in mind, the research team presumes that their mapping tool could be more accurate than 94%.

Intended Use and Application

The hope for this tool is that it will develop new approaches to enhance the U.S. Fish and Wildlife’s National Wetland Inventory (NWI), and promote accurate wetland location predictions. The Chesapeake Conservancy is expanding the mapping model to other states to train the model on different geographies. It will be interesting to see how this model improves overtime and whether its usage will be released to the public for wetland identification.

Sources

Chesapeake Conservancy. (2023). Artificial intelligence deep learning model for mapping wetlands yields 94% accuracy. Retrieved from https://phys.org/news/2023-01-artificial-intelligence-deep-wetlands-yields.html.

Gallant, A.L. (2015). The challenges of remote monitoring of wetlands. Remote Sensing, 7(8), 10938-10950. Retrieved from https://doi.org/10.3390/rs70810938.

Mainali, K., Evans, M., Saavedra, D., Mills, E., Madsen, B., & Minnemeyer, S. (2023). Convolutional neural network for high-resolution wetland mapping with open data: Variable selection and the challenges of a generalizable model.
Science of The Total Environment, 861. Retrieved from https://doi.org/10.1016/j.scitotenv.2022.160622.

U.S. Fish and Wildlife Service. (n.d.). Wetlands data limitations, exclusions and precautions. Retrieved from https://www.fws.gov/node/264582

Plant Community Mapping

One of the biggest challenges to new delineators, and even some experienced wetland delineators, is getting the plant community mapping done right. This is a very important task as it serves as the basis for where and why the wetland sampling points are located where they are.  As you may recall, the US Army Corps of Engineers Wetland Manuals require that each plant community should be represented by a sampling point.

The Regional Supplements are not much help on this. They describe in very generic terms what some of the common plant communities in the region and even sub-region are. For example, this is an excerpt from the Eastern Mountains and Piedmont Regional Supplement.

Northern Mountains and Piedmont (MLRAs 147 and 148 of LRR S):

This sub region includes the northern Appalachian ridges and valleys (MLRA 147) and the northern Piedmont (MLRA 148). The ridge-and-valley portion is underlain by Paleozoic sandstones, conglomerates, limestones, and shales, whereas the Piedmont portion is underlain by generally older metamorphic and igneous rocks. The central portion of the Piedmont also contains sandstones, conglomerates, and shales that were laid down in the ancestral Atlantic Ocean during the Triassic period. Average annual rainfall over most of the sub region ranges from 31 to 52 in. (785 to
1,320 mm), and average annual temperature ranges from 44 to 57 °F (7 to 14 °C) (USDA Natural Resources Conservation Service 2006).

Only about 55 percent of the ridge-and-valley portion of the sub region and 25 percent of the Piedmont portion are forested today. Agricultural and urban development makes up the remainder of the sub region. Common tree species in forested areas include white oak, black oak, northern red oak, bear oak (Q. ilicifolia), chestnut oak, American elm, hickories, tulip tree, Virginia pine, pitch pine (P. rigida), eastern redcedar, and other species (Society of American Foresters 1980; USDA Natural Resources Conservation Service 2006).

As you can see, there is a general description of the trees found in the region.  However, there is not much else. In this example understory species are not mentioned and there is no discussion of the other plant communities in this area. The Corps goes on to later extol the need to identify the plant communities.

“The manual uses a plant-community approach to evaluate vegetation. Hydrophytic vegetation decisions are based on the assemblage of plant species growing on a site, rather than the presence or absence of particular indicator species. Hydrophytic vegetation is present when the plant community is dominated by species that require or can tolerate prolonged inundation or soil saturation during the growing season.”

So, getting this right is particularly important. To help you with this, I have a few tips and tricks to get you started.

First, you need to identify a plant community text for your region. For example in North Carolina, the Classification Of The Natural Communities Of North Carolina Third Approximation by Michael P. Schafale and Alan S. Weakley (1990) is a great reference document for understanding how these plant communities are distinguished.

This is an excerpt of the vegetation description for a specific plant community. Location, geology, soils and other features are described relative to this community type.

Carolina Hemlock Bluff

Vegetation: The canopy is well developed, though not always closed, owing to extreme rockiness and steepness. Tsuga caroliniana is the dominant trees; species such as Quercus montana (prinus), Pinus rigida, Pinus pungens, Quercus rubra, or Tsuga canadensis often occur. Undergrowth is generally a dense layer of heaths, especially Kalmia latifolia, Rhododendron catawbiense, Gaylussacia spp., and Vaccinium spp. The herb layer is very sparse below the dense shrub growth. Species may include Gaultheria procumbens, Mitchella repens, Chimaphila maculata, Galax urceolata (aphylla), Xerophyllumasphodeloides, and Trilliumundulatum. Bryophytes (Dicranumspp., Leucobryumalbidum, and L. glaucum) and lichens (Cladonia spp. and Cladina spp.) are sometimes prominent.

From this description alone you would be able to develop a plant list and assign wetland indicators.

In just about every state there exists a plant inventory and classification text.  Most of these are published by a state land grant university.  These are usually the major agricultural institutions.   However, in the North Carolina example one professor is from NC State and the other is from the University of NC.  NC State has a major agricultural program.  UNC is more of a research institution.  This collaboration has produced a terrific document and a great example of universities working together.  Just don’t bring up basketball.

Guide to Using a Laser Level

The use of a survey grade level is critical for obtaining accurate measurements of various biological features, biological benchmarks, etc.  This information is used for many purposes including stream restoration, coastal restoration, wetland restoration, and other design purposes.

There are two types of levels used for construction and design. The older of the two is known as the Dumpy level. This level is like a spotting scope with crosshairs. It is highly accurate (despite its name) and has an added advantage of being able to measure distance. However, it does require much more work to operate and is limited to a range of about 30 feet.  It also requires two people to operate.

Laser levels are the other commonly used measuring tool and are a significant improvement over the Dumby levels. The major benefit is that the distance away from the level is pretty much as far as you can see.  This reduces the number of station moves and speeds the process along.  You also only need to have one person to operate the level.

There is a third option which is to use a surveyor total station. This, however, is a complicated process and usually beyond the level of detail needed for most biological assessments.  A corollary to this is the use of GPS. GPS is great for x and y coordinates, but it is often meters off on the elevation (z).

Laser Levels

You do not need to spend a lot of money to purchase a quality laser level. You can often find these for sale in big box home improvements stores and hardware stores.  They are around a couple of hundred dollars. You can also rent one from a survey supply shop for about $20-$30 per day. Survey grade levels are usually in the $500 to $1000 range.  This is worth the investment if this type of work is a regular thing for you.  Also, do not cheap out on the box. The level will get bounced around so you will need a quality instrument case.  This is sometimes a problem with the home center levels.

The laser receiver is usually included with the laser level.  This is a little box that attaches to the survey rod with thumb screws.  It takes batteries and makes a tone when the laser beam from the level hits it.

The level should be placed upon a quality tripod. This is not the same type as you use for a camera. Survey grade tripods are usually made of wood or aluminum and have steel spikes to set it into the ground.  The legs are adjustable so that you can adjust your level. The level should be about chest high when mounted so the tripod needs to be 4-5 feet high when set up.

Next on your shopping list is a survey rod. You want to get the smallest rod that will serve the purposes of the site work you are doing. A 12-foot rod is much better than a 25-foot rod if you only need to go up a few feet. The bigger the rod the more sway you have, and the measurements will be less accurate. However, if you have a steep slope on your site, a bigger rod may be necessary.

You will also need a measuring tape or carpenter’s rule.  It is better to get one that is calibrated to 1/10’s of a foot rather than inches.  The survey rod is always in 1/10’s of a foot, however, make sure you are not using a metric rod.

Set Up

The first thing that you want to do is take a walk around the area that you need to survey. You want to find the best place to set up the level so that you do not need to move it more than necessary. Keep an eye on slope, trees and other obstructions.  The level needs a clear line of sight. You can clear some of the vegetation away, but it is usually easier to find a spot that would require the least amount of work to get your shots. The tripod should be set up above the highest point you are going to survey. You need to include the height of the level receiver on the rod when you are making this estimate. This translates to about 5 feet above your highest point. The level needs to be able to “see” the receiver.  If the level is set is too low it will shoot below the receiver mounted on the rod.  You can move the receiver down, but that would require that you recalculate for those shots.

Keep the level in the box until you are ready to place it on the tripod.  Do not attach it to the tripod and then walk around with it.  It should be boxed when moving it around the site.

Set the legs up on as level a surface as you can. Adjust the legs so that the level mounting plate is fairly level. You can use a hand level to do this or the bubble level on the laser level itself.

The laser level attaches to the tripod by way of a large screw below the mounting plate. Do not tighten this too much until you have leveled the level. There are three or four leveling screws on the level. There is also a glass bubble level on the mounting plate. Adjust the leveling screws so that the level is dead on the level in all directions. This will require that you spin the level around and make adjustments. If you have attempted to level the tripod before you mounted the level, this will go fairly quickly. 

Instrument Height

There is usually a marking on the level where you should measure downwards to the ground. We are also going to determine the height of the instrument using the back site, but you should always measure the distance from the instrument to the ground.

Backsight

You should place a project benchmark somewhere near the level set up. This serves as your project control and can be surveyed for real later if you need to derive actual elevation points from your level runs. This control should be set using a pin, rod, pipe or other relatively permanent makers. Wooden stakes do not work as they can be easily removed or damaged.

The backsight elevation is any number that makes sense. The convention is to set it at 100.  You may come back later in drag control onto the site to determine the actual elevation, but that is not necessary for this type of work.

The laser level indicator should be attached to the rod, usually at the tip. Note the location of the indicator. For example, it is on the rod at 4.5 feet. Most telescopic rods have a height indicator on the back of the rod.  As you raise the rod the height indicator numbers will change.  Be careful to raise the rod in the proper order.  This varies with some rod types so be sure to check with the manufacturer on the use of the rod.

A Direct Elevation Rod or a “ Lenker Rod ” is the most common type and has numbers in reverse order on a graduated strip that revolves around the rod on rollers. Figures run down the rod and can be brought to the desired reading—for example, the elevation of a point or benchmark. Rod readings are preset for the backsight, and then, due to the reverse order of numbers, foresight readings give elevations directly without calculating backsights and foresights.

Turn the laser on and position the rod on the benchmark and raise the rod until you hear a steady tone. You will usually hear a slow chip when you are just below the laser beam and a fast chirp when you go past it.  Note the rod reading. That is your backsight reading. Add the elevation from the benchmark rod reading and you have your height of instrument (HI).

For example, your benchmark is elevation one hundred. Your rod reading on that benchmark is 4.06.  Therefore, your Height of Instrument (HI) is 104.06’.  Your benchmark elevation should be lower than the instrument ground location.  If not, you need to adjust the detector and do some more math. It can be done, but it takes more time.

Now you are ready to go to work on the foresight.

Position the rod directly on the ground at each feature shot. The rod should be straight up and down. There are plumb levels you can attach to the rod to help you. Some laser detectors will also beep at you if you are too far out of plumb.

Raise the rod until you hear that steady tone. Note the rod reading. Make sure that you raised the rod in the right order and that the numbers are being read correctly.  Usually, this is a matter of checking reality.  If your rod reading suddenly jumps by 5 feet from the last point you may have raised the rod sections in the wrong order.

Record each feature and provide some notes. A level book works great for this. This is an example of a level book set up.

Set Up-Example 1

At each feature subtract the foresight (FS) from the Height of Instrument (HI) to derive the elevation.

In this example, we have a 1.28’ difference from mid tide (MT) to Mean High Water (MHW). We can, therefore, assume that our total tidal exchange would be 2.56’ from Mean Low Water (MLW) to MHW.

We would need to check many other points. Usually, for a biological benchmark survey, we would to stationing along a cross-section.  Each feature would be relative to the feature type and its location on the cross-section.  In our example above, the distance from the MT to MHW is 25’.  This is measured by setting a fixed starting point at 0+00 and measuring along that line.

If you need to move the level you will need to calculate a new HI.  Make sure to reference the setup with the data.  Start a new table for a new set up.

Finally, if you need to determine the real elevations of your features survey the benchmark. This will require a surveyor to locate nearby elevation control and drag that onto the site using traverse lines. You can also use high-end GPS for this.  In our example above the real elevation for the benchmark is 456’ NAVD 88.  Our new HI is 460.06.  We need to make sure we cite the vertical data source. In this case, it is North American Vertical Datum of 1988 (NAVD 88). Therefore, our MT is 453.43’ NAVD 88 and the MHW is 454.71’ NAVD 88. You can do this for all the data associated with the benchmark.

One final note

If you are doing level runs for design purposes, you may or may not need a licensed land surveyor to sign off on them.  However, if you are doing any floodplain calculation work you will most likely need the help of a licensed surveyor. Some jurisdictions allow licensed professional engineers to do this as well. This is a matter of state and federal law so be careful and ask questions.